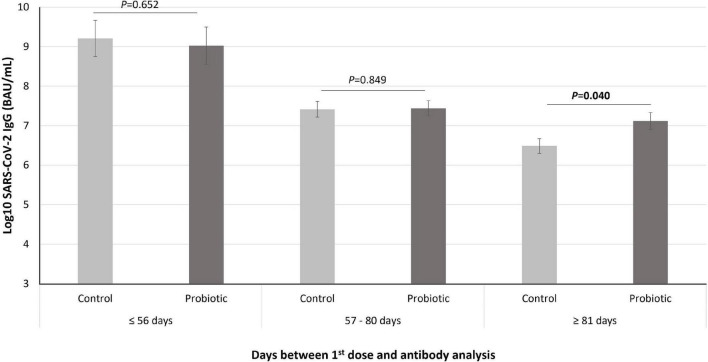
FIGURE 2.
Levels of SARS-CoV-2 IgG (represented in Log10 of BAU/mL) in the subjects that received the COVID-19 vaccine during intervention (n = 85) divided into tertiles according to the days between the first dose and the antibody analysis. Data are represented as mean (bars) and SE (vertical lines). P value indicated differences between probiotic group (dark gray bars) and control (light gray bars) groups (univariate models adjusted by age, sex, age, type of vaccine, and start of the intervention).

