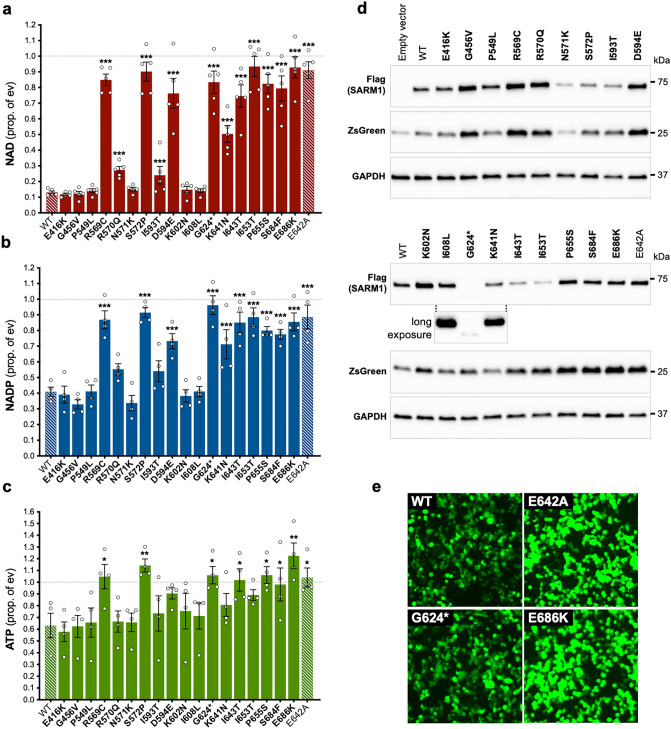
Figure 2.
Several SARM1 TIR domain variants do not deplete NAD in transfected HEK 293T cells. (a,b,c) Endogenous levels of NAD (a), NADP (b), and ATP (c) were assessed in extracts from HEK 293T cells 24 h after transfection with 1 μg of a bicistronic construct co-expressing WT or variant SARM1 together with ZsGreen. Values are shown relative to those from cells transfected with empty vector (ev) control only (set at one, dashed black line). Means ± SEM with individual data points (from n = 4 or 5 experiments) are plotted. *p < 0.05, **p < 0.01 and ***p < 0.001, multiple pairwise comparisons to WT SARM1 with FDR correction (after log transformation of data in part a). Bars for the positive and negative controls (respectively WT SARM1 and the enzyme-dead E642A SARM1 artificial mutant) are hatched to differentiate them from the selected variants (bold text, filled bars). (d) Representative immunoblots of transfected HEK 293T cell extracts. Blots were probed with a Flag antibody to detect Flag-tagged SARM1 protein (~ 70 kDa), and antibodies against co-expressed ZsGreen (~ 26 kDa) and GAPDH (~ 36 kDa, acting as a loading control). A long exposure of the Flag antibody blot for the lower panel of variants, showing just the G624* SARM1 and flanking lanes, is included to demonstrate that G624* SARM1 is expressed but at a very low level relative to other variants. (e) Micrographs showing ZsGreen expression in HEK 293T cells transfected with constructs co-expressing the selected SARM1 variants as shown. While the intensity of ZsGreen fluorescence differed depending on the activity of the SARM1 variant being expressed, the majority of cells were transfected (ZsGreen positive) in each case. Differences in SARM1 (and ZsGreen) expression detected in part d are therefore not the result of substantial differences in transfection efficiency and was true for all variants, not just those shown.

