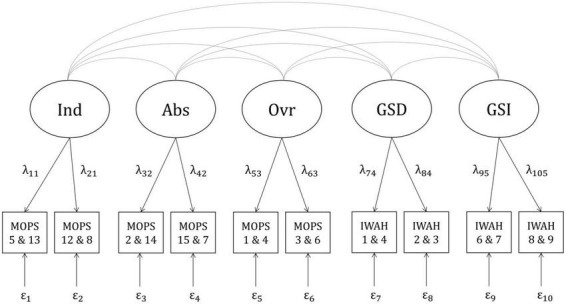
FIGURE 2.

Negative model with correlations between negative RPB and IWAH. Ind, indifference; Abs, abuse; Ovr, over-control; GSD, global self-definition; GSI, global self-investment; MOPS, “Measure of Parental Style”; IWAH, “Identification With All Humanity scale”. Latent factors (e.g., Ind) are displayed in circles. Indicators (e.g., MOPS 5 and 13) are displayed in squares. Numbers beneath the abbreviations of questionnaires indicate item numbers of the items forming particular indicators (e.g., Item 5 and item 13 from the MOPS form one indicator displayed as MOPS 5 and 13). Curved lines indicate correlations between latent factors. Arrows with factor loadings (e.g., λ11) illustrate the assumption that the indicators are predicted by specific latent factors. Residual variances are displayed below the indicators (e.g., ε1).
