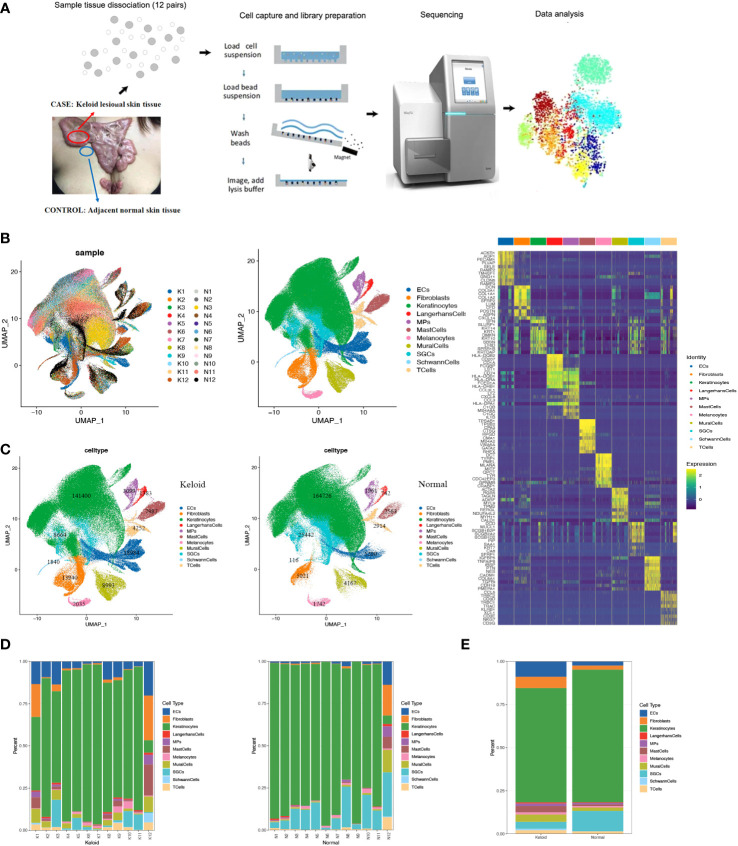
Figure 1.
Single-cell RNA-seq (scRNA-seq) reveals the cellular diversity and heterogeneity of keloid skin tissue. (A) Schematic representation of the experimental procedure. Keloids and adjacent normal skin tissues were harvested separately at the time of surgery (n=24). (B) Uniform Manifold Approximation and Projection (UMAP) of unbiased clustering of 427,171 cells reveals 11 cellular clusters. Clusters are distinguished by different colors. The number in the parenthesis indicates the cell count. (C) Hierarchical clustering of the clusters based on the average expression of the 2,000 most variable genes. (D) Comparison of the ratio of cells in keloids and adjacent normal skin tissues. (E) Representative molecular signatures for each cell cluster. SGCs, sweat gland cells; ECs, vascular endothelial cells; MPs, mononuclear phagocytes.

