Figure 2.
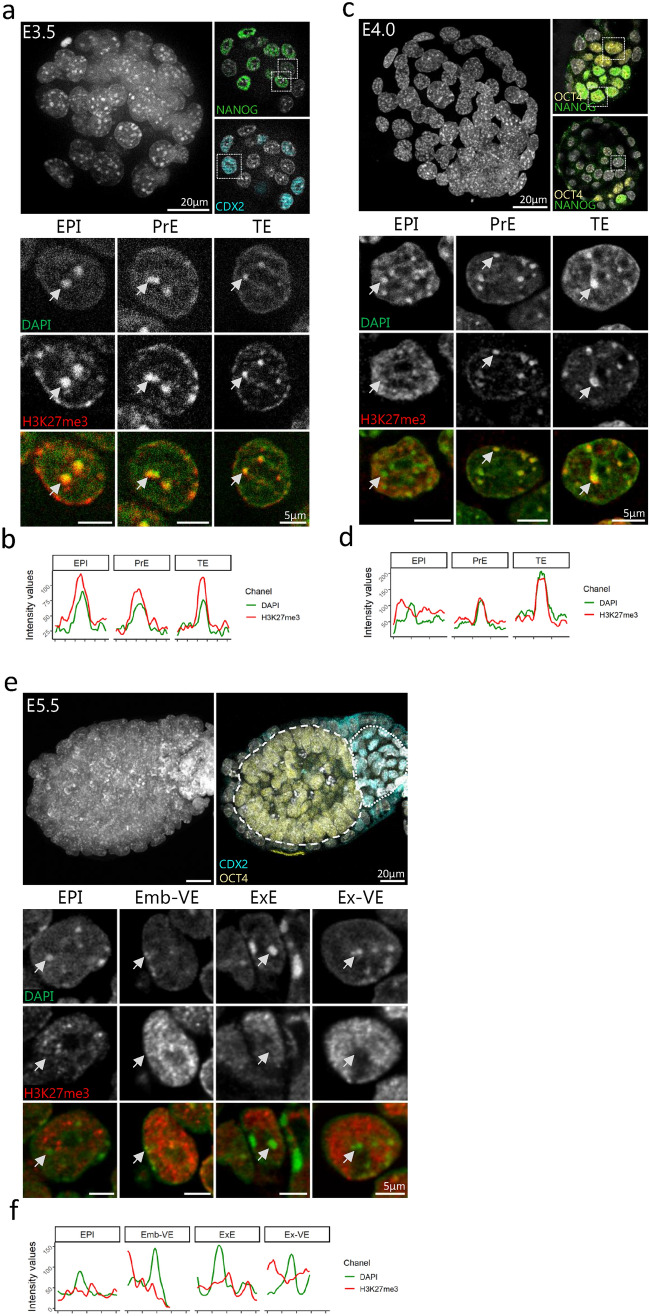
Comparison of the pattern of H3K27me3 at chromocenters between embryonic to extra-embryonic lineages in peri-implantation stages embryos. (a, c and e) Upper left panel shows the Z-projection of a whole E3.5 (a), E4.0 (c) or E5.5 (e) embryo, counterstained with DAPI. Scale bar represents 20 µm. Upper right panels show a section with a highlight of ICM/EPI cells stained with NANOG (a, c) or OCT4 (c, e), TE or ExE cells stained with CDX2 (a, e) or PrE/VE cells stained with OCT4 only (c). Bottom panels show a representative nucleus for each presumptive lineage after immunostaining with H3K27me3 (red) and DAPI at E3.5 (a), E4.0 (c) and E5.5 (e). The last row is the merge of the two signals. EPI = Epiblast cells, PrE = Primitive Endoderm cells, TE = Trophoblast cells, ExE = Extra-embryonic Ectoderm cells, Emb-VE/Ex-VE = Visceral Endoderm cells in embryonic/extra-embryonic region respectively. (b, d and f) Graphs show the intensity profiles of DAPI (green) and H3K27me3 (red) signals across a single chromocenter highlighted by arrowheads in lower panels (a, c and e). Graphs were generated using ggplot256 (v3.3.5) in R and figures were arranged with FigureJ55 in Fiji54 (v1.53c).

