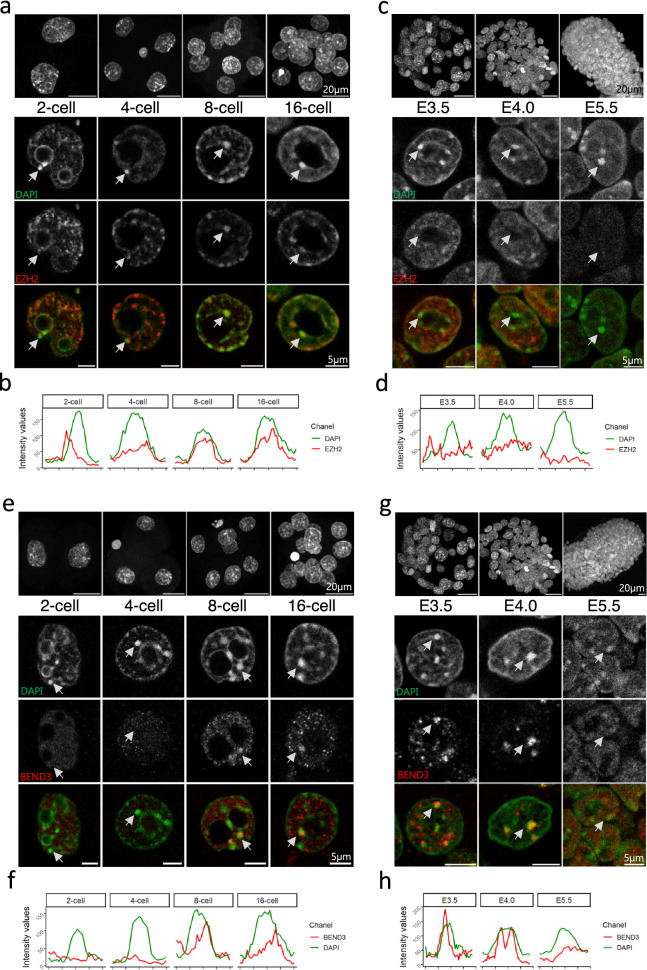
Figure 5.
Patterns of EZH2 and BEND3 during peri-implantation development. (a, c) Upper panels show the Z-projection of a whole embryo at 2-, 4-, 8- and 16-cell (a) and at E3.5, E4.0 and E5.5 (c). Lower panels show a representative nucleus at each stage after staining with DAPI (green) and EZH2 (red). Arrows point to a chromocenter using to draw the intensity profile shown in (b) and (d). (e, g) Upper panels show the Z-projection of a whole embryo at 2-, 4-, 8- and 16-cell (e) and at E3.5, E4.0 and E5.5 (g). Lower panels show a representative nucleus at each stage after staining with DAPI (green) and BEND3 (red). Arrows point to a chromocenter using to draw the intensity profile shown in (f) and (h). Graphs were generated using ggplot256 (v3.3.5) in R and figures were arranged with FigureJ55 in Fiji54 (v1.53c).

