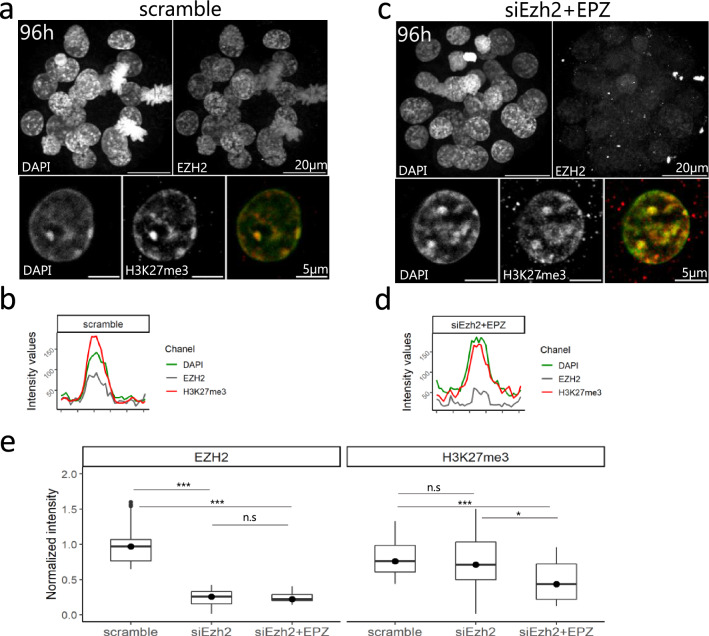
Figure 6.
Knock-down of EZH2 and its effects on H3K27me3 accumulation at PCH. (a, c) Early blastocysts at 96 h of culture after electroporation with scramble (a) or siEzh2 (c) and stained for EZH2 (grey), DAPI (green) and H3K27me3 (red). Upper panels show a z-projection of a whole embryo, while lower panels show a representative nucleus. (b, d) The graphs show the intensity profiles of DAPI, H3K27me3 and EZH2 signals across a single chromocenter. (e) Quantification of total signal intensity of EZH2 and H3K27me3 in nuclei (n = 20) of scramble, siEzh2 and siEzh2 + EPZ treated embryos. *** Pvalue < 10−3; ns = non significant; Mann–Whitney test. Graphs were generated using ggplot256 (v3.3.5) in R and figures were arranged with FigureJ55 in Fiji54 (v1.53c).

