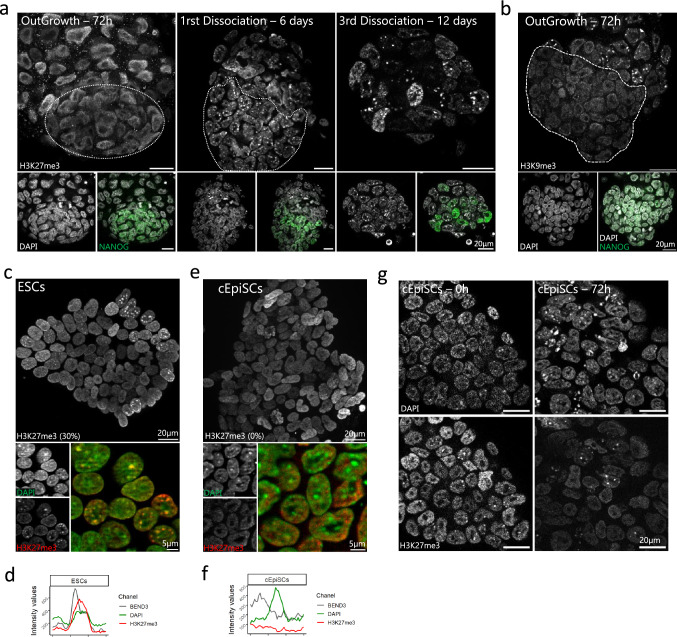
Figure 7.
Comparative H3K27me3 enrichment at chromocenters during ESCs derivation and cEpiSCs conversion. (a) From left to right: H3K27me3 staining profile at different time points of ESC derivation from blastocysts cultured in 2i/LIF medium. (b) H3K9me3 staining in 72 h outgrowth. For (a) and (b), DAPI and NANOG staining are presented in the lower panels. The pluripotent cell population is delineated by a white dashed line. (c, e) ESCs and 10 days converted EpiSCs (e) colony stained for H3K27me3 (red), DAPI (green) and merge signals. (d, f) The graphs show the intensity profiles of DAPI, H3K27me3 and BEND3 signals across a single chromocenter for ESCs (d) and cEpiSCs (f). (g) Dynamics of H3K27me3 disappearance at 0 and 3 days post-medium switching from 2i/LIF to FGF2/Activin. Graphs were generated using ggplot256 (v3.3.5) in R and figures were arranged with FigureJ55 in Fiji54 (v1.53c).

