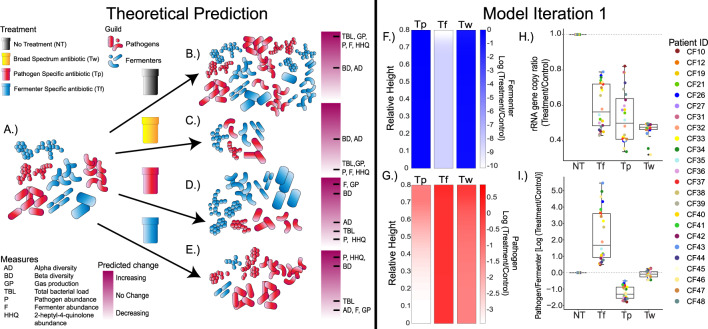
Fig. 2. Theoretical predictions and Model iteration 1.
The initial microbiome is composed of both pathogens and fermenters and is illustrated in (A), but the proportions of these are unique to each patient. Under pressure of the various treatments (B) NT, (C) Tw, (D) Tp, and (E) Tf the predicted community response is illustrated. The response i.e., (expected change) in common microbiome measures as indicated in the legend (yellow = increase, red = decrease). The measures are the following: Alpha diversity (AD), Beta diversity (BD), gas production (GP), total bacterial load (TBL), pathogen abundance (P), fermenter abundance (F), and 2-heptyl-4quinolone abundance (HHQ). The model output treatment-to-NT log-ratio of (F) fermenter population and (G) pathogen population of patient 12 as an example with spatial variation at t = 50 h. Boxplots showing model outcomes of the (H) 16S rRNA gene copy ratio and (I) Pathogen to Fermenter log-ratio compared to the control. Each patients’ actual sputum Pathogen/Fermenter ratio was used as input to the model (n = 24). The dotted grey line denotes no change from treatment.

