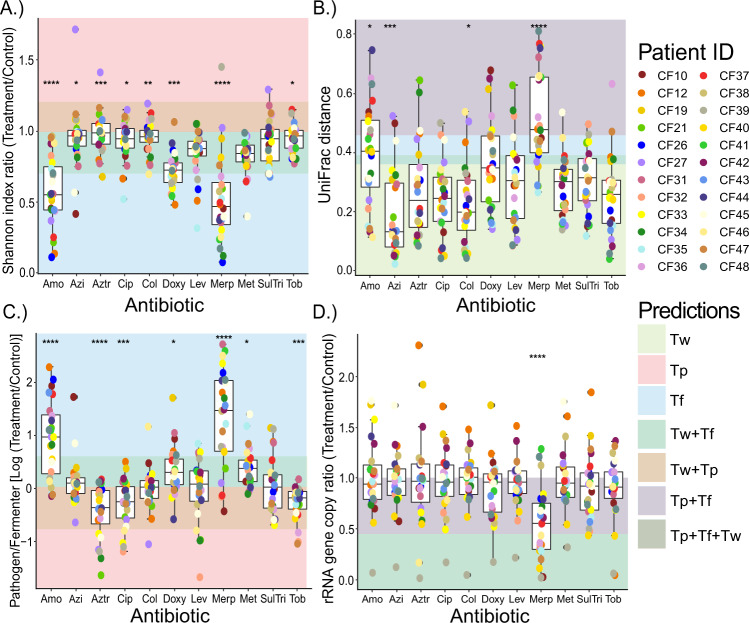
Fig. 3. Different microbiome community measure changes compared to the no-antibiotic control.
The impacts of antibiotics (n = 11, Amo = amoxicillin, Azi = azithromycin, Aztr = aztreonam, Cip = ciprofloxacin, Col = colistin, Doxy = doxycycline, Lev = levofloxacin, Merp = meropenem, Met = metronidazole, SulTri = bactrim and Tob = tobramycin) compared to untreated control samples on (A) Shannon index ratio, (B) Weighted UniFrac distance, (C) pathogen to fermenter log ratio, and (D) rRNA gene copy ratio. Individual points are colored by patient (n = 24). The shaded areas behind the boxplots are regions of the plot where the outcomes of our theoretical predictions and/or model iteration 1 would lie if correct, colored according to antibiotic treatment type (Tw, Tp, and Tf). Kruskal-Wallis statistics are reported in Table S8. Asterisks denote p-value significance where ****p ≥ 0.0001, ***p ≥ 0.001, **p ≥ 0.01, *p ≥ 0.05. Mann-Whitney post hoc tests are reported in the Supplementary material (Tables S10–S16).

