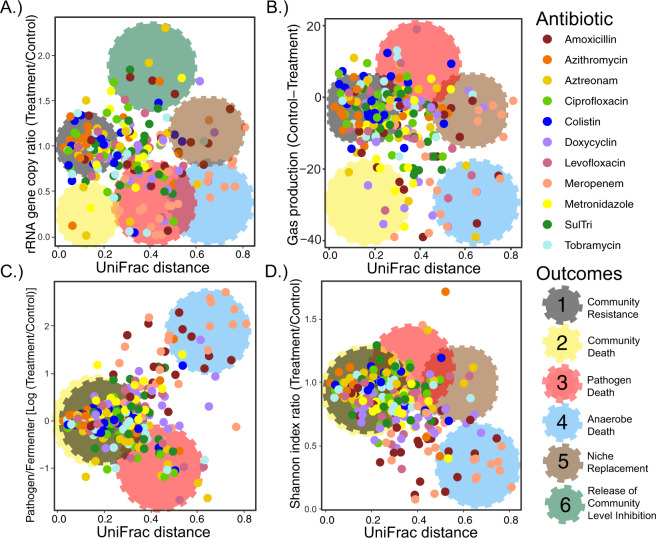
Fig. 4. Characterizing outcomes in the antibiotic experiment.
Weighted UniFrac distance compared to (A) rRNA gene copies, (B) Gas production, (C) Pathogen to fermenter log ratio, (D) Shannon index. Individual points are colored by antibiotic treatment (n = 11). Observed outcomes (Community resistance, community death, pathogen death, anaerobe death, niche replacement, and release of community level inhibition) are highlighted via large cogs on each of the panels colored by the outcome they represent. These highlighted regions are meant to aid in visualization of their presence in the overlying data. Cutoff values of for the outcomes are further described in Table S17.

