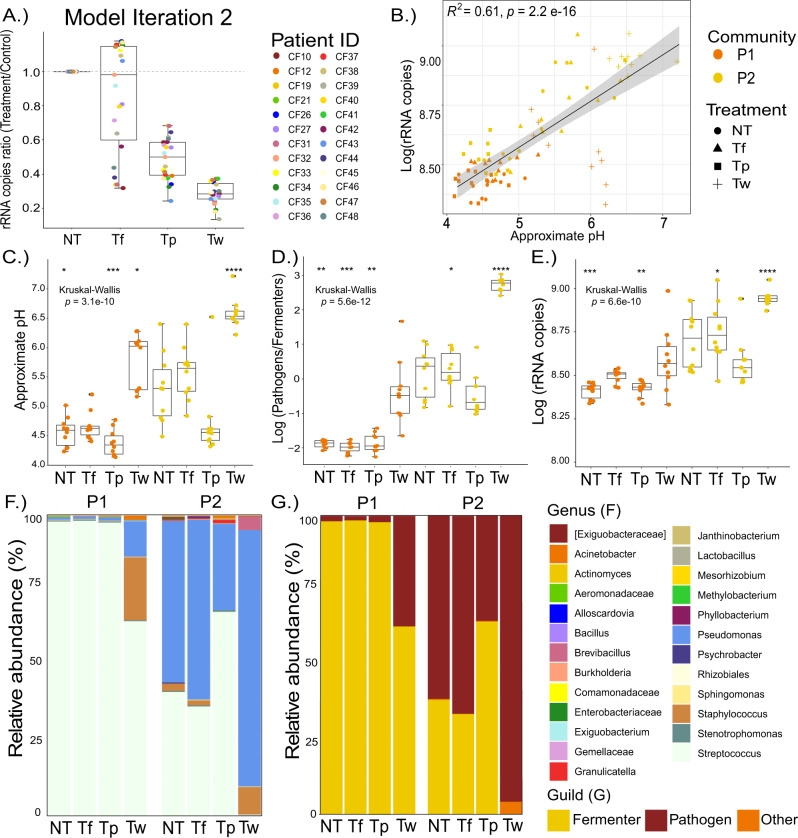
Fig. 5. Model alteration and verification.
(A) Model iteration 2 outcomes of 16S rRNA gene copy ratio of each patients’ actual sputum Pathogen/Fermenter ratio was used as input to the model (n = 24). Individual points are colored by antibiotic treatment (n = 11). The dotted grey line denotes no change from treatment. Subsequent experimental validation using two communities, P1 and P2 (n = 10), showing the (B) pH in relation to log rRNA gene copies, (C) Approximate pH, (D) Pathogen/Fermenter log ratio, (E) log rRNA gene copies, (F) Genera abundance, (G) Distribution based on genera-classification as classical pathogen or anaerobic fermenter. Asterisks denote p-value significance where ****p ≥ 0.0001, ***p ≥ 0.001, **p ≥ 0.01, *p ≥ 0.05.

