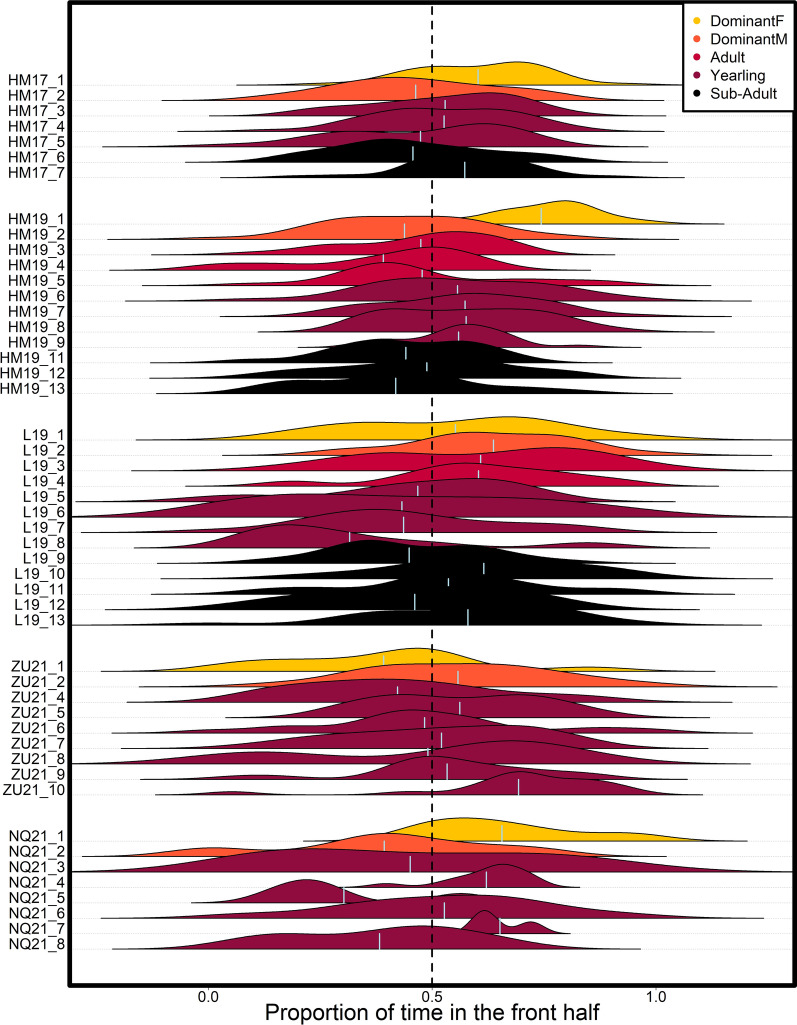
Figure 3.
Distribution of the proportion of time spent in the front half of the group over 1-h time periods, for each individual in the 5 study groups (vertical axis). Color indicates individual status, light vertical lines within each distribution indicate the overall mean proportion of time spent in the front half of the group for that individual. Vertical dotted line indicates equal amount of time spent in the front and in the back half of the group.

