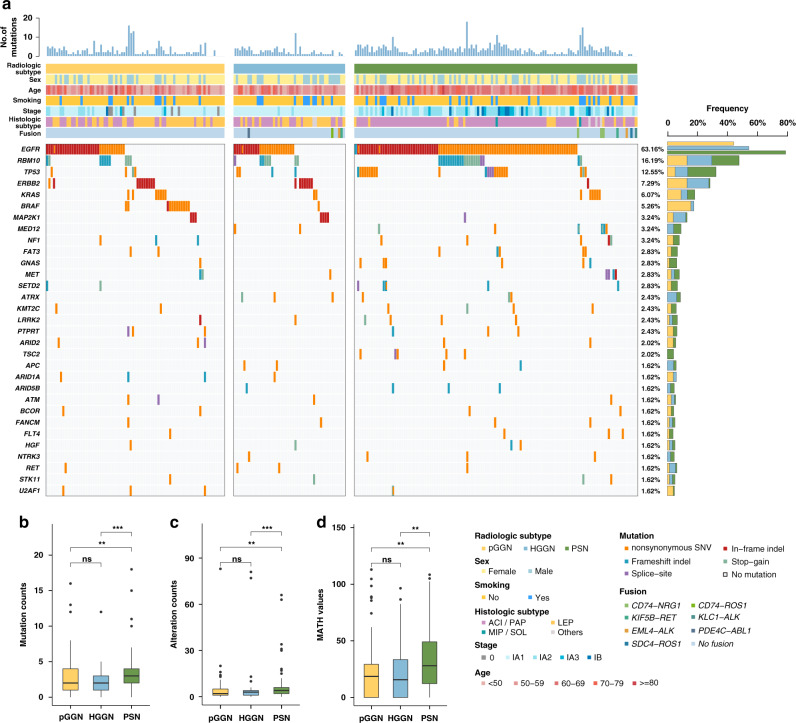
Fig. 1. Association between radiological subtype and genomic features in the broad-panel NGS cohort.
a Oncoprint of the most frequently mutated genes (top 30) by radiological subtype. b Box plot of tumour mutation count versus radiological subtype. c Box plot of genomic alteration count versus radiological subtype. d Box plot of the MATH score versus radiological subtype. MATH mutant-allele tumour heterogeneity.

