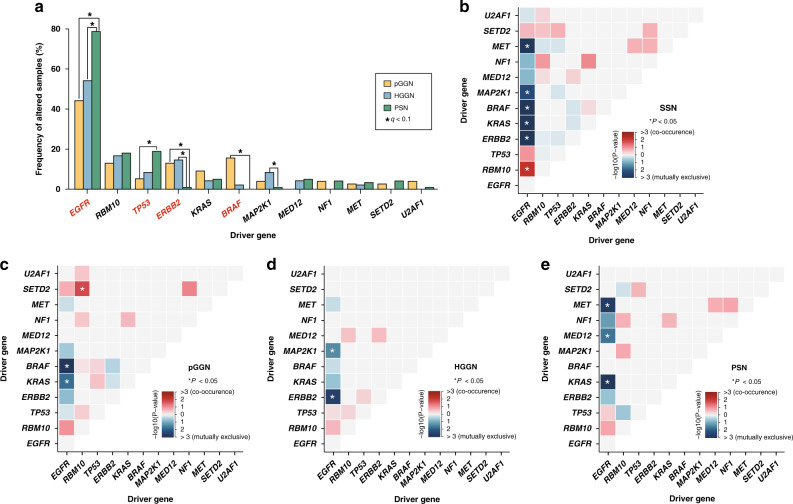
Fig. 2. Analyses of driver genes detected by dNdScv algorithm in the broad-panel NGS cohort.
a Comparison of mutation frequency of driver genes among radiological subtypes. Drivers with significant differences using Fisher’s exact test were labelled with asterisks (FDR q < 0.100), while those with significant differences in Cochran–Armitage test for trend were highlighted in red (P < 0.050). b–e shows co-occurrence (red) and mutual exclusivity (blue) of driver genes in SSN, pGGN, HGGN, and PSN cohorts. FDR false discovery rate.

