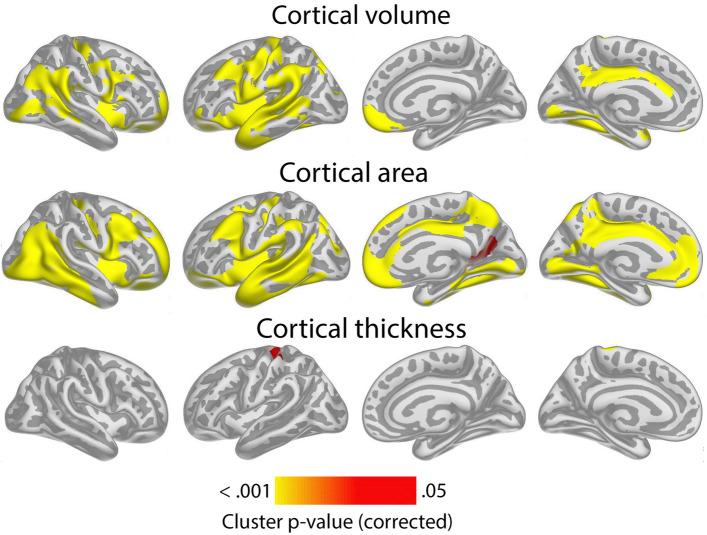
Figure 1.
Level-level associations: meta-analytic cluster p-value maps of the associations of general cognitive ability (GCA) and cortical characteristics, controlled for education. Meta-analytic cluster p-value maps (Lifebrain and UKB) of the relationships between GCA at baseline and cortical characteristics are shown, when age at baseline, sex, time (since first scan) and education are controlled for (p < 0.05, corrected using a cluster-forming p-value threshold of p < 0.01). Relationships are shown, from left to right for each panel: right and left lateral view, right and left medial view.

