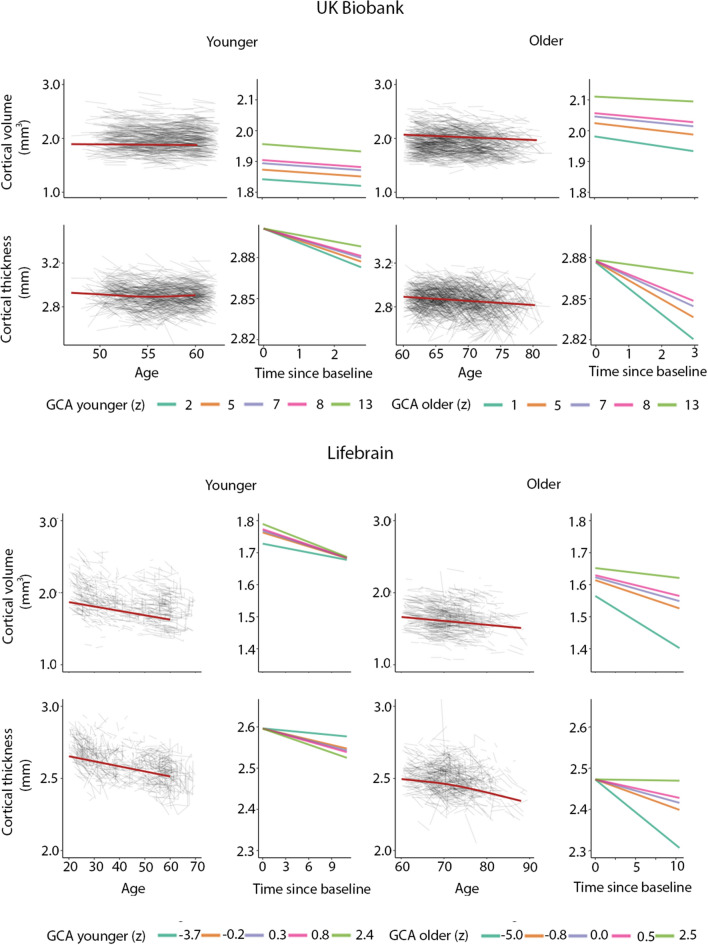
Figure 7.
Cortical volume and thickness change trajectories according to general cognitive ability (GCA) for young and older adults. For illustrative purposes, expected trajectories are shown for young (< 60 years at baseline) and older (> 60 years at baseline) in UKB (top panels) and Lifebrain (lower panels) per quintile of GCA, for mean cortical volume and thickness in the analysis model and regional significant sites shown in Fig. 6. For UKB, the quintiles refer to actual scores from min to max (0–13) on the test, whereas for Lifebrain, the quintiles refer to z-scores (where mean is zero) min to max for the samples.

