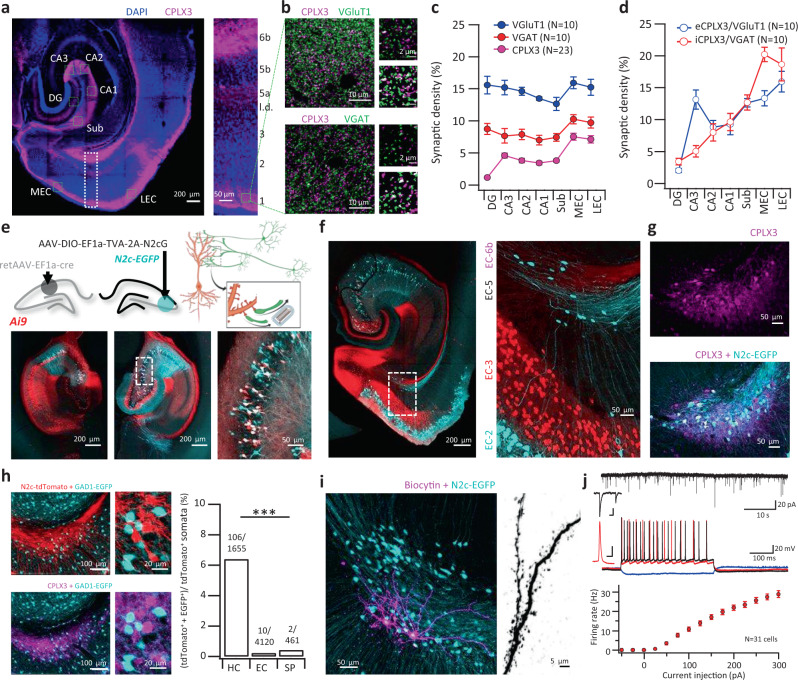
Fig. 1. A direct excitatory projection from EC-6b to hippocampal CA3.
a Representative horizontal section stained for CPLX3 and DAPI (left) alongside an expanded view of the cortex (right). b Representative STED images from LEC-1, stained for CPLX3 alongside either VGluT1 (top left) or VGAT (bottom left). Expanded inserts are shown to the right of each image above their corresponding mask, demonstrating the calculation of colocalization for each marker. c Analysis of synaptic density, using STED images acquired from the fields denoted by green dashed squares in (a). Synaptic density was calculated here as the ratio between the signal area and total image area. d Relative eCPLX3 and iCPLX3 signal density of the total VGluT1 or VGAT signal area. e Unilateral injection of retAAV into the CA1 enables genetic targeting of the contralateral CA3 for retrograde labeling, exploiting the abundance of commissural axons of CA3 pyramidal neurons (top schematics). Representative horizontal sections from the mid-dorsal hippocampus of the ipsilateral (bottom left) and contralateral (bottom center) hemispheres for RetAAV-cre injection. Double-labeled neurons in the enlarged inset (bottom right) are putative starter cells. f, g Representative horizontal section from the ventral hippocampus following CA3-specific retrograde labeling reveals a population of neurons in the deepest layer of the EC (f), which immunolabels positive for the subplate-specific marker CPLX3 (72/78 cells counted from 5 animals, g). h Representative horizontal sections of the layer 6b following retrograde labeling with CVS-N2c(deltaG)-tdTomato, from CA3 neurons of a GAD1-EGFP mouse (left). Numbers above the bars in the right-hand panel indicate the total number of double-labeled tdTomato+/EGFP+ somata out of the total tdTomato+ somata per each of the regions examined (P = 1.2 × 10⁻⁹; two-sided Fisher’s exact test). i Two biocytin-labeled CA3-projecting pSPNs (magenta) from an acute hippocampal section (left) and an enlargement of a dendritic segment (right). Experiment has been reproduced for 12 cells with identical results. j Representative traces of spontaneous EPSCs (top trace) and membrane potential following current injections of −50 pA (blue), 100 pA (red), and 200 pA (black; bottom traces). Summary plot below shows the firing frequency as a function of current amplitude (N = 31 cells). Scale bars for magnified representative EPSCs (top trace) and first AP at rheobase current (bottom trace) indicate 25 ms/20 pA and 2 ms/20 mV, respectively. N in c, d represents number of individual sections from 6 different animals. Data in c, d, j is shown as mean and SEM.

