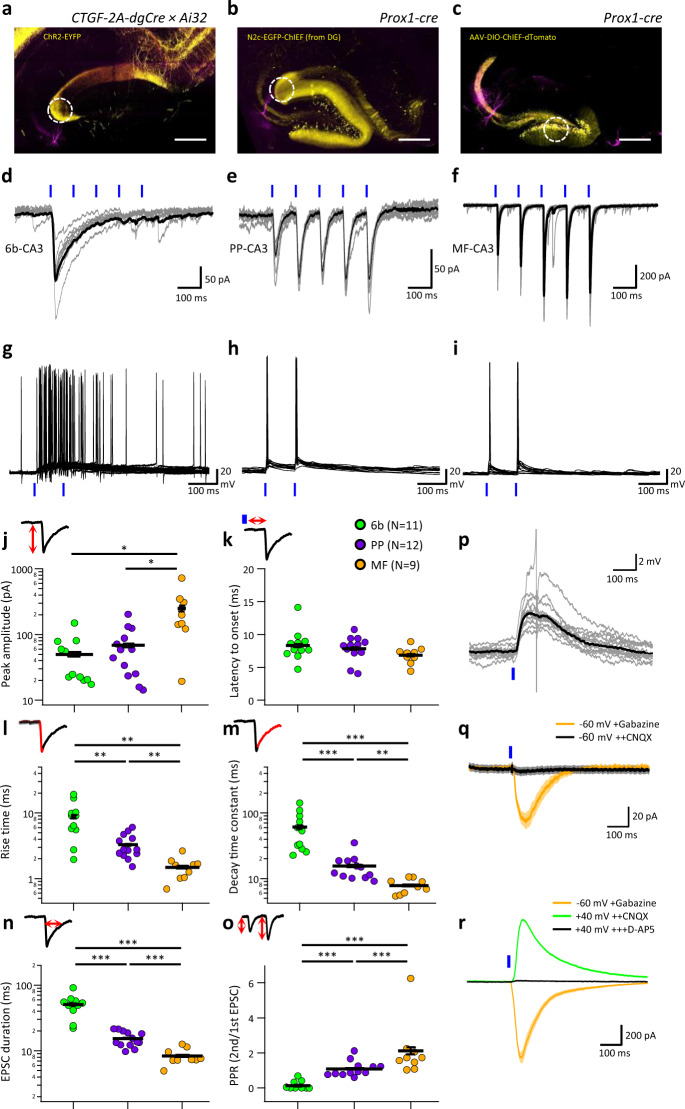
Fig. 4. Synaptic physiology of the EC-6b to CA3 projection.
a–c Representative images of acute hippocampal slices following specific expression of optogenetic actuators (yellow) specifically in EC-6b (a), EC-2 (b), or the DG (c) while recording post-synaptic responses from neurons in CA3b (magenta). White dashed circle indicates region targeted for photostimulation, and scale bars represent 200 µm. d–f Representative individual (gray) and averaged (black) traces of optogenetically-evoked EPSCs, following a 10-Hz train of 5-ms light pulses of the 6b-CA3 (d), PP-CA3 (e), or MF-CA3 (f) projections. g–i Ten overlaid voltage responses to 6b-CA3 (g), PP-CA3 (h), or MF-CA3 (i) stimulation. j–o Summary plots comparing the EPSC properties for each of the pathways: peak amplitude of the first response (j), latency to EPSC onset from the start of the stimulation (k), 20–80% rise time (l), decay time constant (m), duration at half maximum (n), and paired-pulse ratio at 100 ms interstimulus interval (o). Individual data points are shown as open circles and bars denote the mean and SEM for each condition. Schematics above the plots illustrate the measured EPSC property shown in each. p–r Representative 6b-CA3 responses showing plateau-like EPSPs with a single truncated AP (p; gray, individual traces; black, average), EPSCs recorded in the presence of 100 μM gabazine and 25 μM CNQX at a negative holding potential (q) and EPSCs recorded in the presence of 100 μM gabazine, 25 μM CNQX, and 50 μM D-AP5 at a positive holding potential (r). Number of measurements from each condition shown in parentheses in the legend (see k). Plots j–o show individual data points, with mean and SEM shown as vertical and horizontal black lines. Statistical differences with P < 0.05 using two-sided Mann–Whitney test (Holm–Bonferroni adjusted) were considered significant. Single (*), double asterisks (**), and triple asterisks (***) indicate P < 0.05, P < 0.01, and P < 0.001, respectively.

