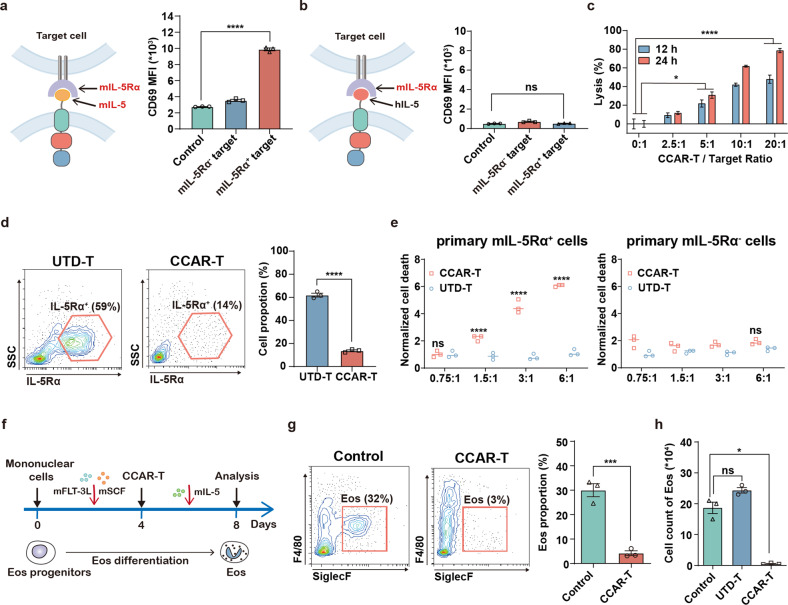
Fig. 3. IL-5-anchored CCAR-T cells show specific cytotoxicity and inhibition of eosinophilic differentiation in vitro.
a Jurkat cells were transduced with mIL-5-anchored CCAR comprising a mouse IL-5 linked to human CD28 costimulatory and CD3ζ signaling domains (m.IL-5-h.28z). Flow cytometry analysis of CD69 expression on mIL-5-anchored CCAR-Jurkat cells after coculture with target cells (U2OS cells) for 24 h. One-way ANOVA, ****P < 0.0001. b Jurkat cells were transduced with hIL-5-CCAR comprising a human IL-5 linked to human CD28 costimulatory and CD3ζ signaling domains (h.IL-5-h.28z). Flow cytometry analysis of CD69 expression on hIL-5-anchored CCAR-Jurkat cells after coculture with target cells for 24 h. Dunn’s Kruskal-Wallis test. c Primary T cells from BALB/c mice were transduced with mIL-5-CCAR comprising a mouse IL-5 linked to mouse CD28 costimulatory and CD3ζ signaling domains (m.IL-5-m.28z). Cytotoxic activity of mIL-5-anchored CCAR-T cells against mIL-5Rα+ U2OS cells. Two-way ANOVA, ****P < 0.0001, *P < 0.05. d Flow cytometry analysis showing the proportion of primary mIL-5Rα+ cells derived from bone marrow after treating with mIL-5-anchored CCAR-T cells or UTD-T cells at a CCAR-T to target ratio of 6:1 in vitro for 8 h. UTD-T, un-transduced T cells. Two-tailed t-test, ****P < 0.0001. e Normalized cell death of primary mIL-5Rα+ cells or mIL-5Rα– cells after treating with mIL-5-anchored CCAR-T cells or UTD-T cells. Differences between mIL-5-anchored CCAR-T cells-treated and UTD-T cells-treated group were examined by two-way ANOVA, ****P < 0.0001. f Timeline of Eos differentiation induction, mIL-5-anchored CCAR-T cell administration, and flow cytometry analysis of Eos. The mIL-5-anchored CCAR-T cells were administrated at a CCAR-T/Target ratio of 3:1. Eos, eosinophil. g Flow cytometry plots showing the proportion of BM-derived Eos after treating with mIL-5-anchored CCAR-T cells or not. BM, bone marrow. Two-tailed t-test, ***P < 0.001. h Histogram of the cell count of BM-derived Eos. Brown-Forsythe and Welch ANOVA, *P < 0.05.

