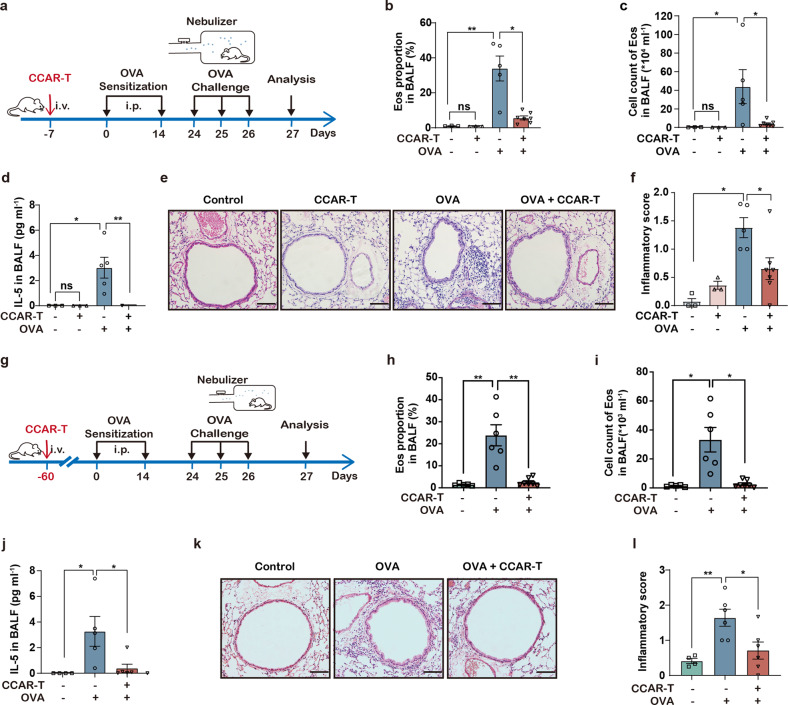
Fig. 5. IL-5-anchored CCAR-T cells exhibit durable asthma control.
a Timeline of intravenous injection of mIL-5-anchored CCAR-T cells, OVA-aerosol administration for the asthma model, and sample analysis in BALB/c mice. b Flow cytometry analysis of Eos proportion in BALF. *P < 0.05, **P < 0.01 by two-tailed Welch’s t-test. c Cell count of Eos in BALF in OVA-induced asthma model. *P < 0.05 by two-tailed Mann-Whitney test. d The concentration of IL-5 cytokine in BALF was determined by CBA. *P < 0.05, **P < 0.01 by two-tailed Mann-Whitney test. e Representative images of the pulmonary sections stained with H&E. Scale bars, 100 μm. f Inflammation scores of the H&E-stained sections determined by semi-quantification. *P < 0.05 by two-tailed Mann-Whitney test. g Timeline of CCAR-T cell administration and sample analysis in the allergic airway inflammation model. h Flow cytometry analysis of Eos proportion in BALF. **P < 0.01 by two-tailed Mann-Whitney test. i Cell count of Eos in BALF. *P < 0.05 by two-tailed Mann-Whitney test. j The secretion of IL-5 cytokine in BALF was determined by CBA. CBA, Cytometric Bead Array. Two-tailed Mann-Whitney test, *P < 0.05. k Representative images of the pulmonary sections stained with H&E. Scale bars, 100 μm. l Inflammation scores of the H&E-stained sections determined by semi-quantification. *P < 0.05, **P < 0.01 by two-tailed Welch’s t-test.

