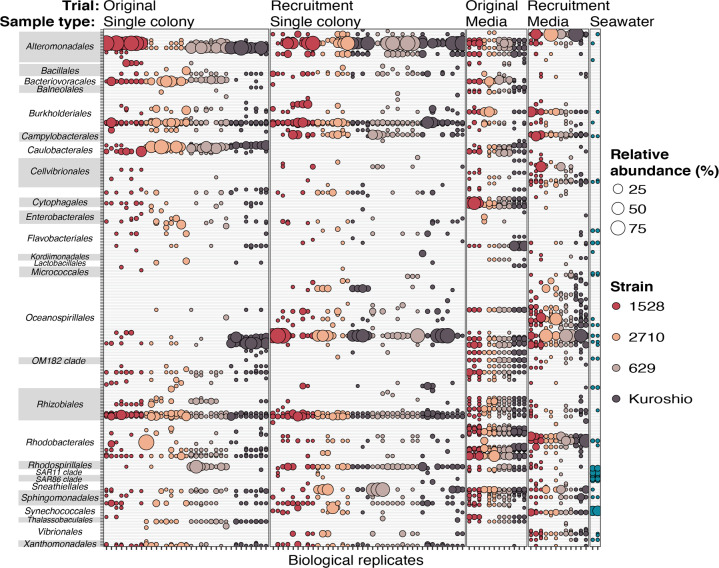
Fig. 4. Relative abundance of OTUs detected in association with Phaeocystis globosa colonies and in culture media.
Data were subset to include only OTUs that were present in at least one single-colony or media sample (i.e., not only present in seawater)—reducing the number of unique OTUs from 781 to 341—and the relative abundance of each remaining OTU in every sample is represented by bubble size. Bubbles are colored by P. globosa source strain or inoculating seawater and are grouped by trial (original or recruitment) and sample type (single colony, media, and inoculating seawater). Columns are biological replicates of each sample type and rows are individual OTUs. OTUs are grouped on the y-axis by taxonomic orders, which appear alphabetically.

