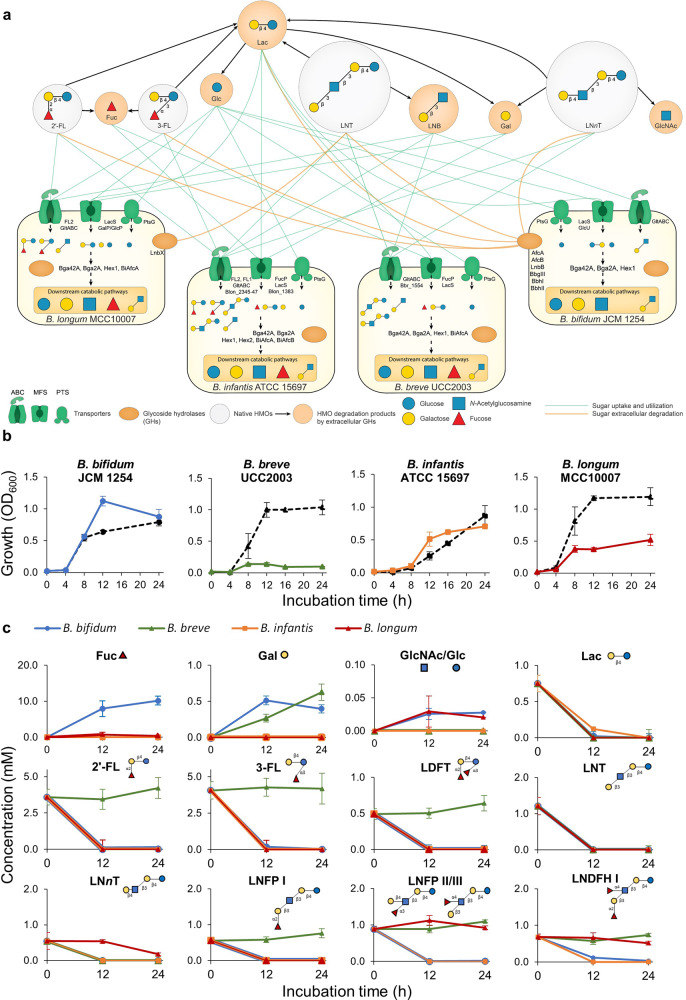
Fig. 1. Genomic and monoculture characterization of infant gut-associated bifidobacteria used in this study.
a Schematic summary of predicted HMO-utilization phenotypes of each bifidobacterial strain. The HMO-utilization phenotypes of each bifidobacterial strain (B. bifidum JCM 1254, B. breve UCC2003, B. infantis ATCC 15697 T, and B. longum MCC10007) were characterized based on genomic predictions. Each strain is shown with its respective transporters and GHs (see Supplementary Table 2). The utilization pathways for four representative HMO molecules (2′-FL, 3-FL, LNT, and LNnT) and their mono- and di-saccharide degradants (Lac, LNB, Fuc, Glc, Gal, GlcNAc) are shown. The green lines indicate sugar uptake and utilization by each strain. The orange lines connect extracellular bacterial enzymes with the substrates. The black arrows connect HMO molecules with their degradants after extracellular degradation. b Monoculture growth curves of each strain grown in HMO-supplemented YCFA medium. Growth of each strain was monitored by measuring OD600 at each time point. All strains were also grown in Lac as a positive control, shown as black dotted lines. Data showing the total OD600 represent averages and error bars represent ± standard deviation of biological quadruplicates. c HMO-utilization profiles of each strain. Culture supernatant was collected at each time point. The remaining sugars in the medium were labeled with 2-AA and analyzed by HPLC (as described in the Materials and Methods section). The consumption of each sugar by each strain is indicated by different colors (blue: B. bifidum, green: B. breve, orange: B. infantis, red: B. longum). Data represent averages and error bars represent ± standard deviation of biological quadruplicates. It should be noted that LNB was not detected at the indicated time points.

