Figure 1.
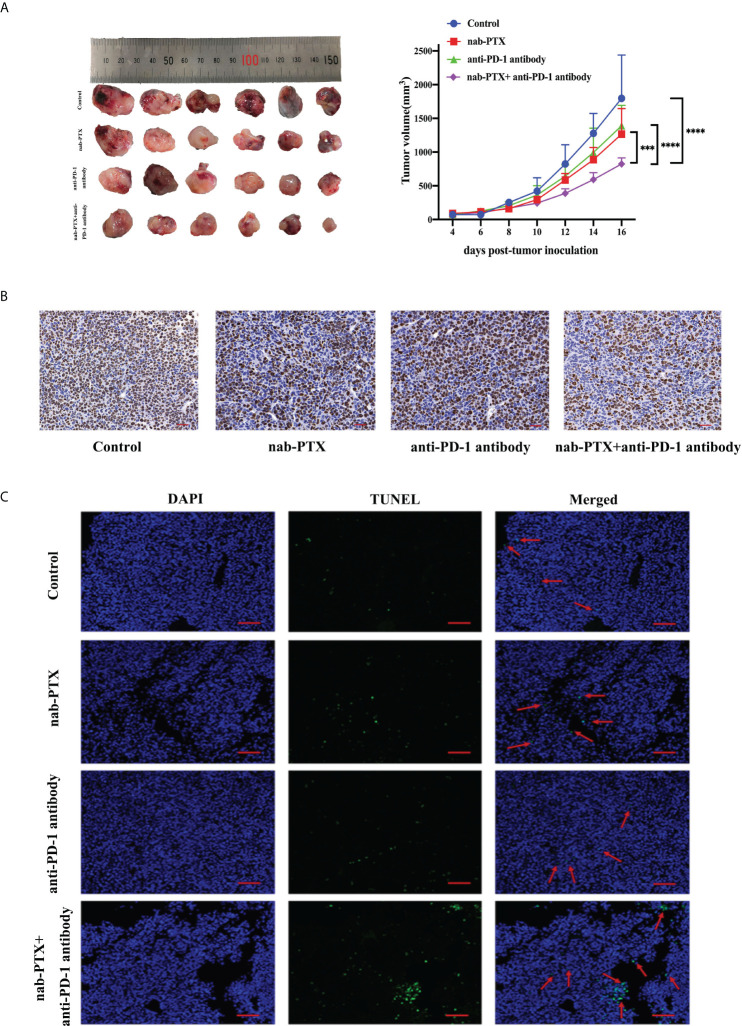
The antitumor responses of mice treated with nab-paclitaxel (nab-PTX) and anti-PD-1 antibody. (A) Macroscopic images and tumor growth curve in mouse LLC cancer models (n = 6, biological duplicates), statistically analyzed with two-way ANOVA followed by Tukey’s multiple comparisons. ***p< 0.001, ****p< 0.0001. (B) Immunohistochemistry staining of Ki67 for tumor sections (n = 3, magnification ×20, biological duplicates). The hematoxylin-stained nucleus is blue, and the positive expression of DAB is brownish yellow. (C) Apoptosis detection of tumor sections by TUNEL staining after the last administration (n = 3, magnification ×200, biological duplicates). Green, TUNEL staining; blue, DAPI. The red arrow denotes a representative TUNEL-positive cell.

