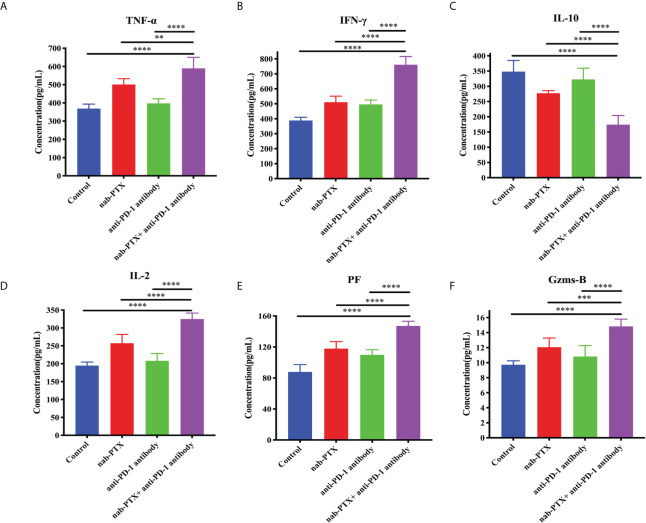
Figure 4.
Concentrations of (A) TNF-α, (B) IFN-γ, (C) IL-10, (D) IL-2, (E) PF, and (F) Gzms-B in the tumor microenvironment with the administration of nab-PTX and anti-PD-1 antibody (n = 3, biological duplicates). TNF-α, tumor necrosis factor α; IFN-γ, interferon-gamma; IL-10, interleukin 10; IL-2, interleukin 2; PF, perforin; Gzms-B, granzymes B. The data were from three independent biological replicates with one-way ANOVA followed by Tukey’s multiple comparisons. **p< 0.01, ***p< 0.001, ****p< 0.0001.

