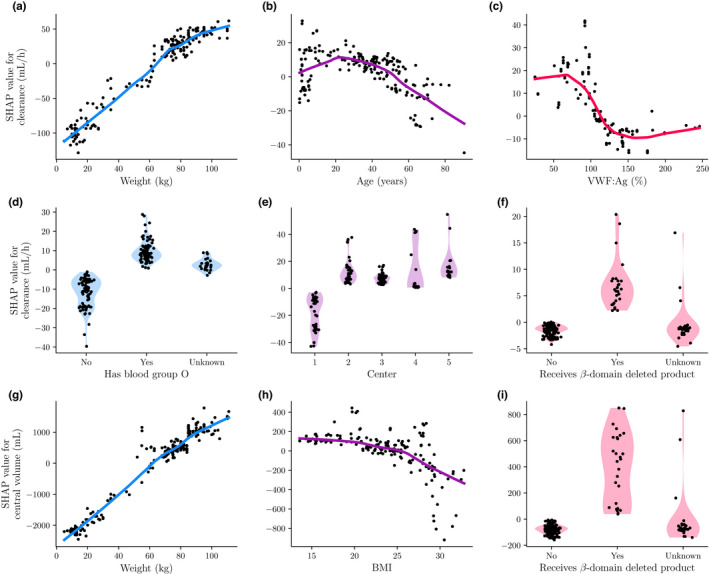
FIGURE 3.

Relationship between covariates and PK parameters based on SHAP values. Here we visualize the relationship between PK parameter and covariate by plotting SHAP value against covariate value. Points represents the SHAP values, while lines indicate the LOESS fitted smooth representation of the relationship. For the categorical covariates the SHAP value density is also shown by means of a violin plot. We have shown the results for the most important covariates for clearance (a–f) and central volume (g–i). BMI, body mass index; LOESS, locally estimated scatterplot smoothing; PK, pharmacokinetic; SHAP, SHapley Additive exPlanations; VWF, von Willebrand factor.
