
FIGURE 2.
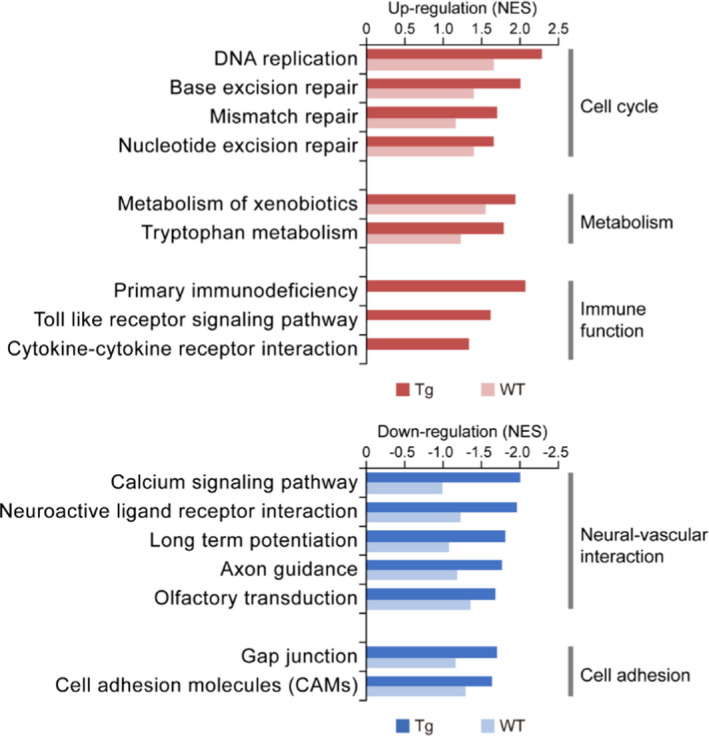
Functional alterations induced by vascular Aβ accumulation in cerebral endothelium. Genes were ranked based on differential expression in 9‐month‐old brain compared to 4‐month‐old brain for Tg and WT mice respectively. The enrichment of pathways with differentially expressed genes were analyzed by GSEA. The normalized enrichment score (NES) is shown for the most affected gene sets enriched with upregulated (red) and downregulated (blue) genes