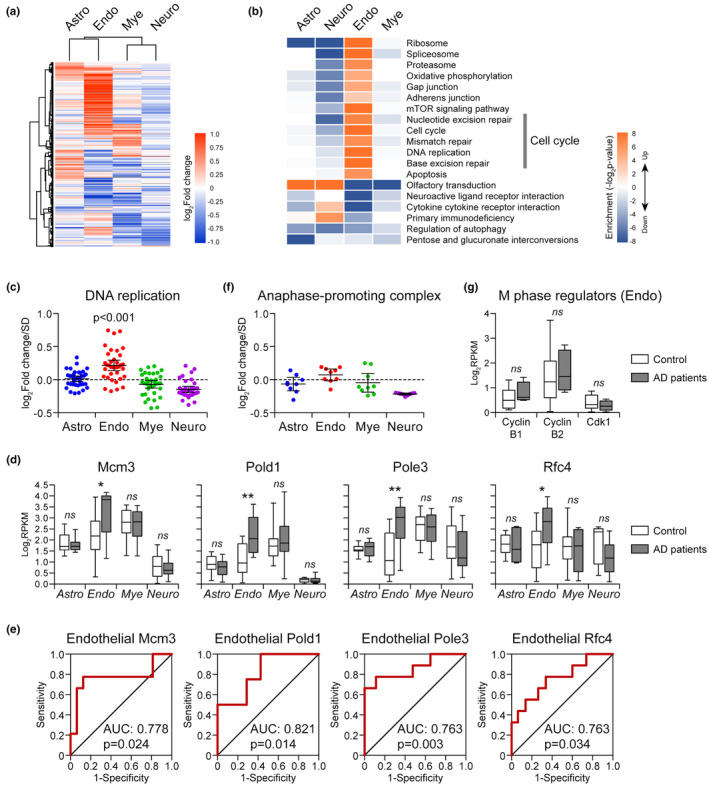
FIGURE 7.

Cell cycle activation status in different brain cells of AD patients. (a) Heatmap of differentially expressed genes in different brain cells of AD patients. (b) Functional alterations in different brain cells with AD development. (c) The expression changes of genes involved in DNA replication in different brain cells of AD patients. (d) The expression of Mcm3, Pold1, Pole3, and Rfc4 in different brain cells of AD patients. (e) Receiver–operator characteristic (ROC) curves for DNA replication regulators in brain endothelium. (f) The expression changes of genes involved in APC in different brain cells of AD patients. (g) The expression change of M phase regulators in AD endothelium. The expression data of AD patients used here were obtained from GSE125050 (Srinivasan et al., 2020). Astro: astrocyte; Neuro: Neuron; Endo: endothelial cell; Mye: myeloid. For Astro, n = 7 (AD group), n = 12 (control group); for Endo, n = 10 (AD group), n = 17 (control group); for Mye, n = 10 (AD group), n = 15 (control group); for Neuro, n = 21 (AD group), n = 21 (control group). *p < 0.05; **p < 0.01; ns, not significant in AD versus control
