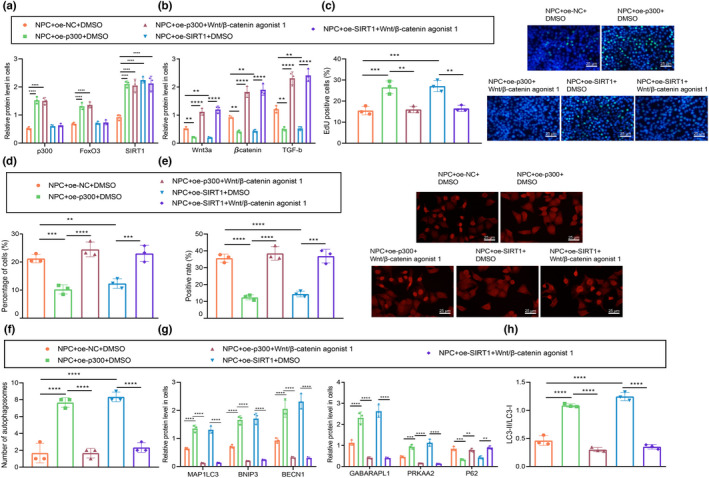
FIGURE 6.

p300‐mediated FOXO3 promotes Sirt1 to inhibit apoptosis of NPCs through inactivation of the Wnt/β‐catenin pathway. (a) Protein expression changes of p300, FOXO3 and Sirt1 in NPCs with different treatment as determined by Western blot assay. (b) The expression of Wnt/β‐catenin pathway‐related factors in NPCs after treatment with Wnt/β‐catenin agonist 1 as determined by Western blot assay. (c) The number of proliferating cells in cultured NPCs as observed by EdU staining (scale bar: 25 μm), green fluorescence represents EdU positive staining and blue fluorescence represents DAPI. (d) The proportion of apoptotic cells in NPCs. * p < 0.05 vs. NPCs treated with oe‐NC + DMSO. # p < 0.05 vs. NPCs treated with oe‐p300 + DMSO. $ p < 0.05 vs. NPCs treated with oe‐Sirt1 + DMSO. (e) Immunofluorescence staining for determination of the nucleation of β‐catenin in NPCs (scale bar: 25 μm), red fluorescence represents β‐catenin positive staining and blue fluorescence represents DAPI. (f) The autophagy in human NPCs as observed by TEM. (g) The protein expression of autophagy‐related factors in NPCs after treatment with Wnt/β‐catenin agonist 1 as determined by Western blot assay. (h) The protein expression of LC3‐II and LC3‐1 and the changes in the ratio of LC3‐II/LC3‐1 in NPCs after treatment with Wnt/β‐catenin agonist 1 as determined by Western blot assay. The measurement data were expressed as mean ± standard deviation. * p < 0.05. ** p < 0.01. *** p < 0.001. **** p < 0.0001. Statistical comparison was conducted using one‐way ANOVA, followed by Tukey post‐hoc test
