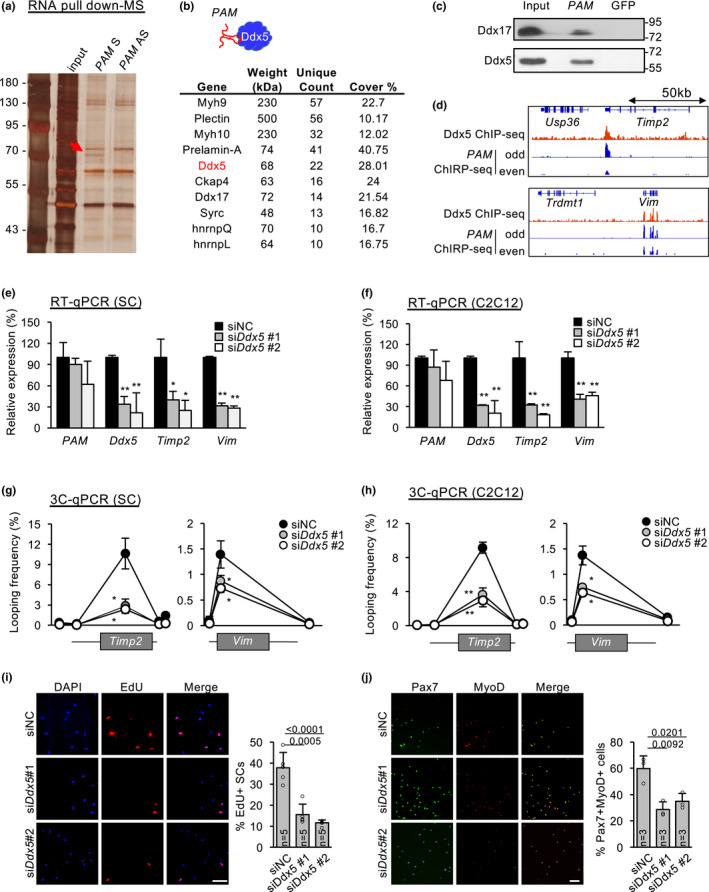
FIGURE 4.

PAM regulates inter‐chromosomal targets via association with Ddx5. (a) RNA pulldown using PAM sense (S) or antisense (AS) experiment followed by SDS‐PAGE. AS was used as negative control. Red arrow indicates enrichment of a protein band at 70 kDa specifically found in pulldown using PAM sense probe. (b) Mass spectrometry (MS) result of the above band showing a list of potential protein binding partners of PAM. (c) RNA pulldown followed by Western blotting of the above identified two candidate protein partners (Ddx5 and Ddx17) of PAM‐ transcript. (d) Genome browser tracks showing Ddx5 ChIP‐seq and PAM ChIRP‐seq on Timp2 or Vim locus. (e,f) ASCs (e) or C2C12 (f) were transfected with either control (siNC) or Ddx5 siRNA (siDdx5#1 or siDdx5#2) oligos, PAM, Ddx5, Timp2 and Vim expression levels were detected by RT‐qPCR 48 h post‐transfection. (g,h) ASCs or C2C12 were transfected with either control (siNC) or Ddx5 siRNA (siDdx5#1 or siDdx5#2) oligos, 3C qPCR was performed to detect chromatin interaction between Timp2 or Vim promoter with PAM locus. (i,j) Knockdown of Ddx5 expression in vitro in cultured ASCs for 48 hours led to reduction in EdU+ (i) or Pax7+/MyoD+ (j) SCs. The percentage of EdU+ and Pax7 + Myod+ cells were quantified. The total number of biologically independent samples are indicated in (i,j). Data information: Data represent the mean ± SD. p‐value was calculated by two‐tailed unpaired t test (*p < 0.05, **p < 0.01). Scale bar: 100 μm
