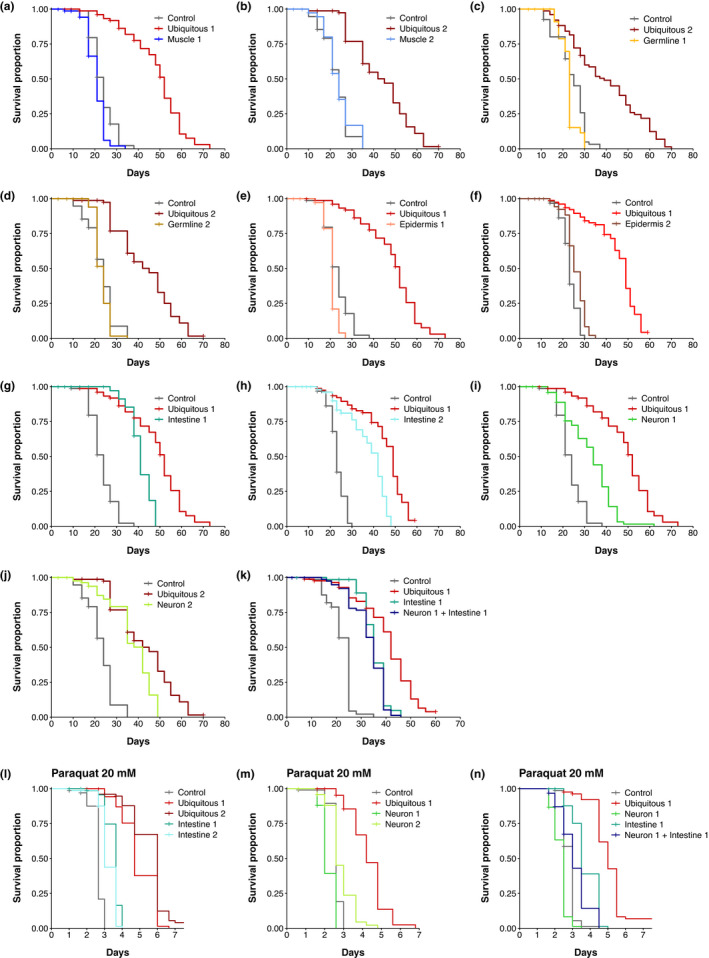
FIGURE 3.

Inactivation of DAF‐2 in neurons or in the gut is sufficient to increase lifespan. (a–k) Survival curves of animals with DAF‐2 depletion in all cells (a–k), muscle (a, b), germline (c, d), epidermis (e, f), intestine (g, h), neurons (i, j), or neurons and intestine (k). Numbers (e.g. Muscle 1, Muscle 2) refer to distinct alleles driving TIR1 expression (see Table S1). For each condition, n is about 80 individuals. Some experiments were split in separate graphs for clarity; thus, some graphs share the same negative and positive controls: (a), (e), (g), (i); (b), (d), (j); (f) and (h). The control conditions correspond to the N2 or daf‐2(kr462) strains, in the presence of EtOH or auxin, whose lifespans did not show significant differences. (l–n) Survival curves of animals with DAF‐2 depletion in all cells (l–n), intestine (l), neurons (m), or neurons and intestine (n) in presence of 20 mM paraquat. Controls correspond to daf‐2(kr462). All strains have been treated with auxin. For each condition, 75 to 100 individuals have been assayed. For detailed lifespan data, replicates, statistics, and summary of independent assays see Table S2 and Figure S2
