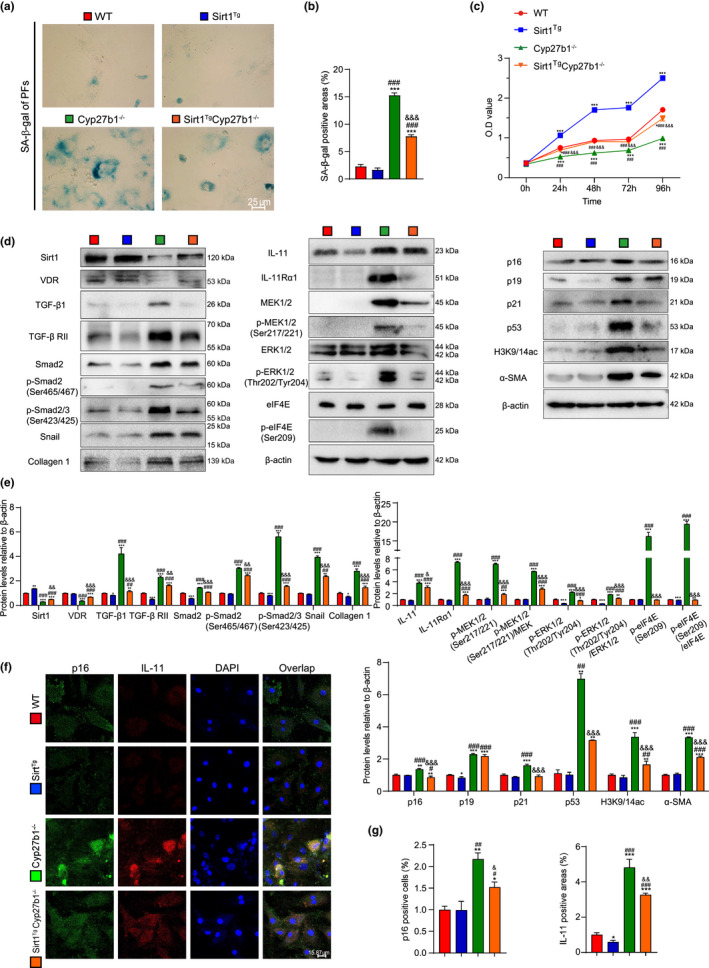
FIGURE 4.

Sirt1 overexpression inhibits cell senescence and TIME signaling, and deacetylates H3K9/14ac in pulmonary fibroblasts from VD‐deficient mice. Pulmonary fibroblasts were isolated from 9‐week‐old WT, Sirt1 Tg , Cyp27b1 −/− and Sirt1 Tg Cyp27b1 −/− mice. (a) Representative micrographs of cells stained cytochemically for SA‐β‐gal. (b) Percentage of SA‐β‐gal‐positive areas relative to the total areas. (c) Second‐passage fibroblast proliferation was determined by CCK‐8 assays and spectrophotometry at 450 nm. Cell number was determined at the indicated times relative to the cell number at hour 0. (d) Western blotting for Sirt1, VDR, TGF‐β1, TGF‐β RII, Smad2, p‐Smad2(Ser465/467), p‐Smad2/3(Ser423/425), Snail, Collagen 1, IL‐11, IL‐11Rα1, MEK1/2, p‐MEK1/2(Ser217/221), ERK1/2, p‐ERK1/2 (Thr202/Tyr204), eIF4E, p‐elF4E(Ser209), p16, p19, p21, p53, acetyl‐histone H3(Lys9/Lys14), and α‐SMA. β‐actin was used as the loading control. (e) Protein expression relative to β‐actin was assessed by densitometric analysis. (f) Representative micrographs of cells immunofluorescently stained for p16 and IL‐11, with DAPI staining the nucleus. (g) The percentage of p16‐positive cells or IL‐11‐positive areas. Three biological replicates were used per experiment. Values are means ± SEM of six determinations. *p < 0.05, **p < 0.01, ***p < 0.001 compared with the WT group; # p < 0.05, ## p < 0.01, ### p < 0.001 compared with the Sirt1 Tg group; & p < 0.05, && p < 0.01, &&& p < 0.001 compared with the Cyp27b1 −/− group
