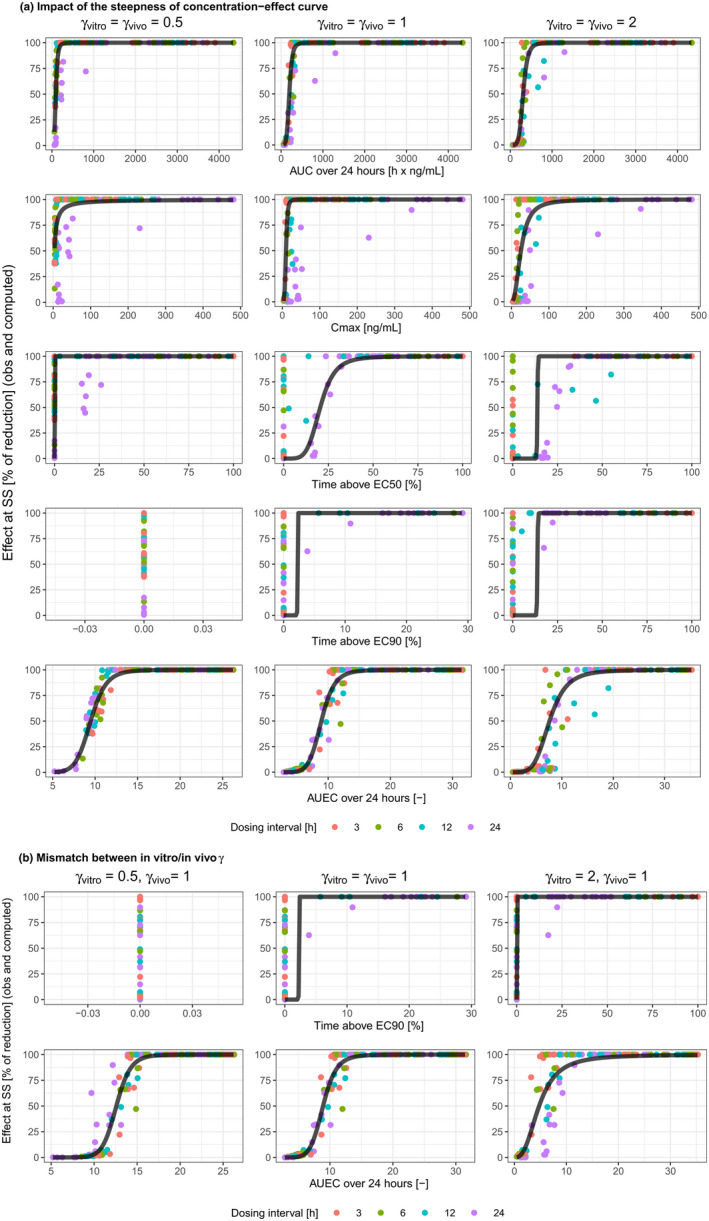
FIGURE 2.

Impact of the steepness of concentration‐effect curve (a), and of its mismatch between in vitro and in vivo experiments (b). AUC, area under the curve; AUEC, area under the effect curve; C max, maximum concentration; EC50, concentration leading to half of the maximum effect; EC90, concentration leading to 90% of maximum effect; obs, observed; SS, steady‐state.
