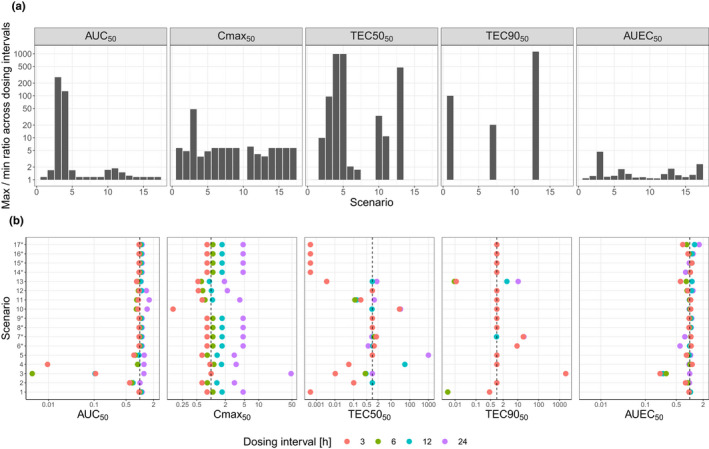
FIGURE 3.

Dispersion of Index50 across the range of dosing intervals, represented as: the maximum‐to‐minimum ratio for Index50s across all dosing intervals (a), the dosing‐interval‐specific Index50 normalized to Index50 estimated in base model (b)
*For AUC24 and C max, fittings for scenarios 6–9 and 14–17 are the same as for scenario 1. For T EC50, fittings for scenarios 14–17 are the same as for scenario 1. AUC, area under the curve; C max, maximum concentration; EC50, concentration leading to half of the maximum effect; EC90, concentration leading to 90% of maximum effect.
