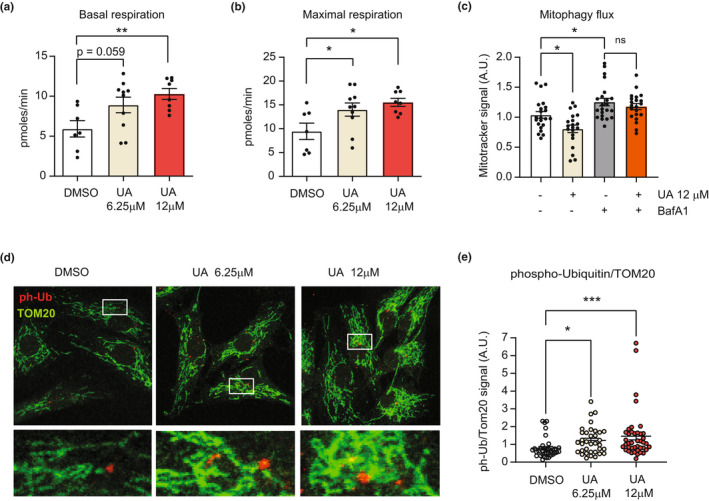
FIGURE 2.

(a, b) Oxygen consumption rates (OCR) showing basal (a) and FCCP‐induced maximal respiration (b) in human primary chondrocytes (HC) from an OA patient, treated with DMSO or UA at 6.25 μM and 12 μM for 24 h (a). (N = 7–10). *p < 0.05; **p < 0.01; after one‐way ANOVA. Error bars represent mean ± SEM. (c) Mitotracker green fluorescent signal, in cells treated with DMSO, 12 μM UA, 100 nM bafilomycin A1 (BafA1) or cotreated with both 12 μM UA and 100 nM BafA1 for 24 h. (N = 22–24). *p < 0.05, after one‐way ANOVA. Error bars represent mean ± SEM. (d, e) Representative images of HC treated as above for 24 h and stained for TOM20 (green) and phospho‐ubiquitin (ph‐Ub, red). White squares indicate the regions corresponding to insets. Nuclei were stained in blue with DAPI (D). Corresponding quantification of the intensity of ph‐Ub over TOM20 (E). (N = 35–40) *p < 0.05; ***p < 0.001 after one‐way ANOVA. Error bars represent mean ± SEM
