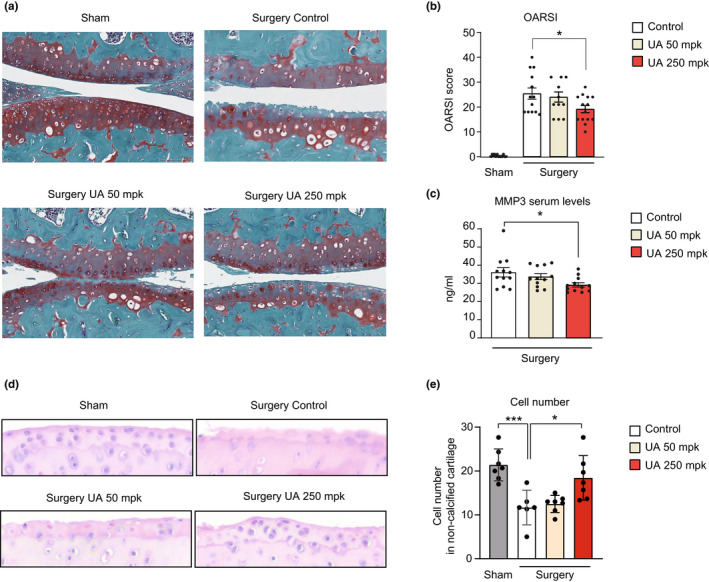
FIGURE 3.

(a) Representative images of safranin‐O staining of knee joints of sham and operated leg. DMM surgery causes cartilage erosion in the middle zone in femur and tibia and additional loss of superficial zone and uncalcified cartilage. Scale bar 100 μM. (b) Mean OARSI score for each mouse, ranging from 0 (no damage) to 48 (maximal degeneration) (n = 13 control, n = 12 UA 50 mpk, and n = 14 UA 250 mpk). *p < 0.05, one‐way ANOVA. Error bars represent mean ± SEM. (c) Serum levels of metalloproteinase 3 (MMP3) in the indicated groups expressed as ng/mL (n = 13). *p < 0.05, one‐way ANOVA. Error bars represent mean ± SEM. (d) Representative joint sections form the indicated groups stained with hematoxylin‐eosin (H&E). Magnification: 10 × . (e) Quantitative analysis of cell number from (d) (N = 6). *p < 0.05, ***p < 0.001 one‐way ANOVA. Error bars represent mean ± SEM
