FIGURE 4.

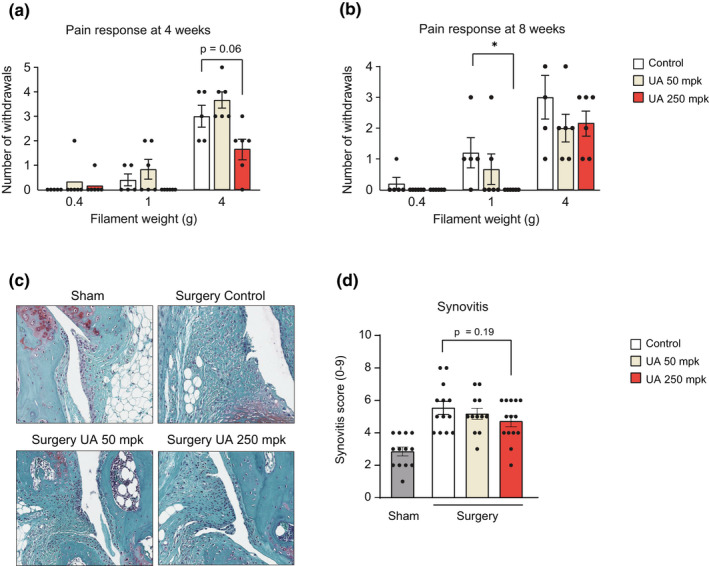
(a, b) Von Frey test performed at 4‐ (a) and 8‐week (B) post‐surgery. The mean withdraw response ± SEM is shown for both legs in each mouse and ranges from 0 (no pain response) to 5 (maximal pain response). Von Frey filaments used correspond to 0.4, 1, and 4 g (n = 5 control, n = 6 UA 50 mpk, and n = 6 UA 250 mpk). *p < 0.05. One‐way ANOVA. Error bars represent mean ± SEM. (c) Representative images of knee synovial membrane in sham and operated leg in the indicated groups, stained with safranin‐O. (d) Quantification of Krenn score to determine synovitis from images as in (c). Data for each mouse range from 0 (no synovitis) to 9 (maximal inflammation) (n = 13 control, n = 12 UA 50 mpk, and n = 14 UA 250 mpk). One‐way ANOVA. Error bars represent mean ± SEM
