Figure 3.

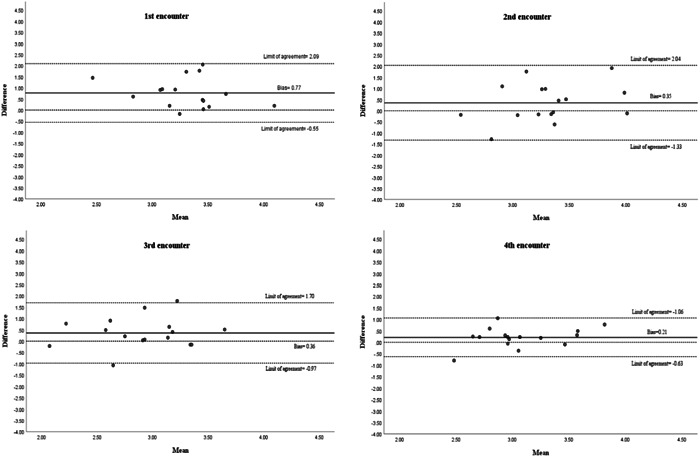
Bland–Altman plots of the differences between self‐assessment and faculty assessment in each encounter against the mean of the two measurements. The bias and limits of agreement are shown as parallel lines to the X‐axis

Bland–Altman plots of the differences between self‐assessment and faculty assessment in each encounter against the mean of the two measurements. The bias and limits of agreement are shown as parallel lines to the X‐axis