Figure 4.

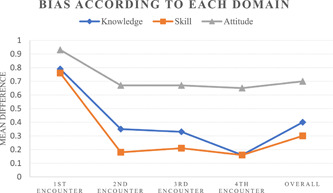
Line graph showing the mean score of the difference (bias) between self‐assessment and faculty assessment in each domain (knowledge, skill, attitude) for each encounter as well as the accumulated score over the 4 encounters

Line graph showing the mean score of the difference (bias) between self‐assessment and faculty assessment in each domain (knowledge, skill, attitude) for each encounter as well as the accumulated score over the 4 encounters