Figure 4.

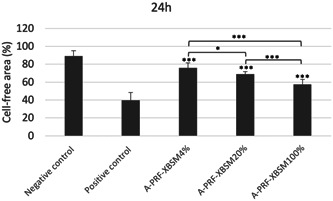
Comparison of the percentage of the cell‐free area among the experiment groups observed at 0, 24 h. (p value: *p < .05, ***p < .001)

Comparison of the percentage of the cell‐free area among the experiment groups observed at 0, 24 h. (p value: *p < .05, ***p < .001)