FIGURE 9.
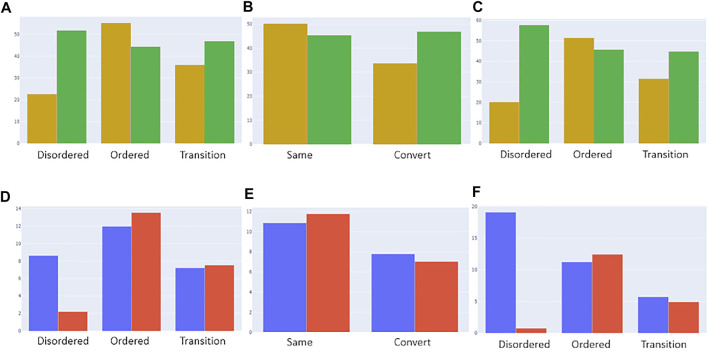
Categorization of deleterious (yellow) and benign (green) mutations from the “canonical_mut” dataset classified as disordered, ordered, and ambiguous based on models 1 [(A), top left], 2 [(B), top middle], and 3 [(C), top right], respectively. The distributions were normalized by the total number of assigned ordered, disordered and ambiguous residues in the dataset. Categorization of germline (blue) and somatic (red) mutations from the “germline_somatic_deleterious” dataset classified as disordered, ordered, and ambiguous based on models 1 [(D), bottom left], 2 [(E), bottom middle], and 3 [(F), bottom right], respectively. The distributions were normalized by the total number of assigned ordered, disordered and ambiguous residues in the dataset and the number of somatic/germline ratios for better comparison.

