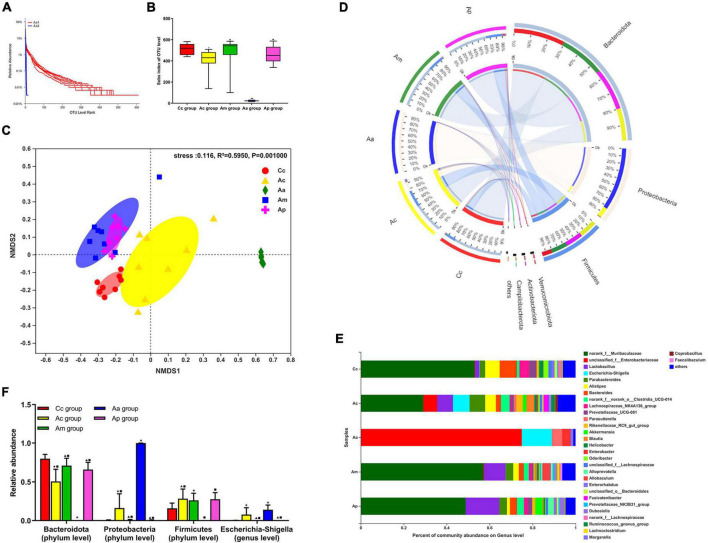
FIGURE 2.
Results of the 16S rRNA in each group (n = 10, mean ± SD). (A) Rank abundance curves in the APP/PS1 antibiotic + manual acupuncture (Aa) group on day 1 (before antibiotic pretreatment, Aa 1) and day 7 (after antibiotic pretreatment, Aa 2). (B) α-Diversity analysis of fecal microbiota by the Sobs index. (C) β-Diversity analysis of fecal microbiota by NMDS. (D–F) Microbial relative abundance at the phylum and genus levels. The Kruskal–Wallis test was used. Chi-square was presented in Supplementary Tables 2, 3 ★P < 0.01 or P < 0.05 compared with the C57BL/6 control (Cc) group, ▲P < 0.01 or P < 0.05 compared with the APP/PS1 control (Ac) group, ■P < 0.01 or P < 0.05 compared with the APP/PS1 antibiotic + manual acupuncture (Aa) group.

