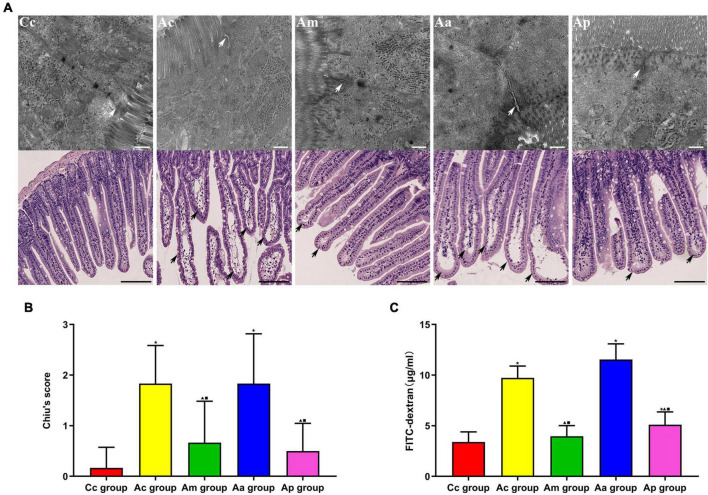
FIGURE 3.
Evaluations of the intestinal barrier integrity and function in each group (n = 6, mean ± SD). (A) Representative images of hematoxylin and eosin (HE) staining (scale bar = 100 μm) and Transmission electron microscopy (TEM) (scale bar = 500 μm) in each group. White arrows show the tight junctions (TJs) between intestinal epithelial cells, and black arrows show intestinal mucous injury sites. (B) Comparison between Chiu’s score of all groups. (C) Comparison between the FITC-dextran level of all groups. A one-way analysis of variance (ANOVA), followed by the LSD multiple-range test, was used with an exception when comparing Chiu’s score, which was analyzed by the Kruskal–Wallis test. LSD-t and chi-square are presented in Supplementary Tables 2, 4. ★P < 0.01 or P < 0.05 compared with the C57BL/6 control (Cc) group, ▲P < 0.01 or P < 0.05 compared with the APP/PS1 control (Ac) group, ■P < 0.01 or P < 0.05 compared with the APP/PS1 antibiotic + manual acupuncture (Aa) group.

