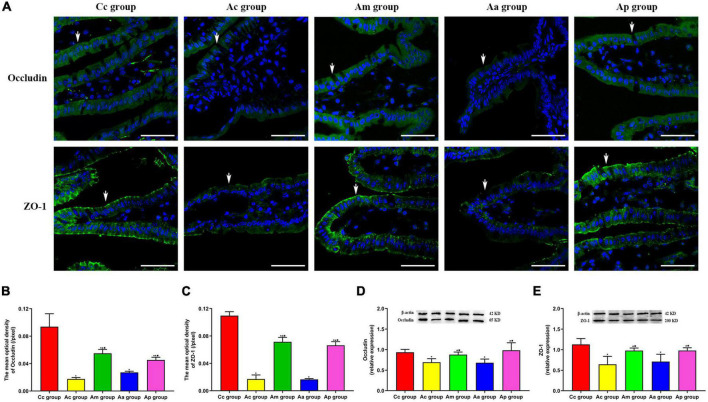
FIGURE 4.
Results of the expression of intestinal tight junction proteins occludin and ZO-1 in each group (n = 6, mean ± SD). (A) Representative images of immunofluorescence (IF) staining of occludin (green) and ZO-1 (green) in each group, the positively stained cells are shown with white arrows, and scale bar is 50 μm. (B,C) Comparison between the mean optical density of occludin and ZO-1 of all groups. (D,E) Comparison between the relative expression of occludin and ZO-1 of all groups. A one-way analysis of variance (ANOVA), followed by the LSD multiple-range test, was used with an exception when comparing the relative expression of ZO-1, which was analyzed by the Kruskal–Wallis test. LSD-t and chi-square are presented in Supplementary Tables 5–7. ★P < 0.01 or P < 0.05 compared with the C57BL/6 control (Cc) group, ▲P < 0.01 or P < 0.05 compared with the APP/PS1 control (Ac) group, ■P < 0.01 or P < 0.05 compared with the APP/PS1 antibiotic + manual acupuncture (Aa) group.

