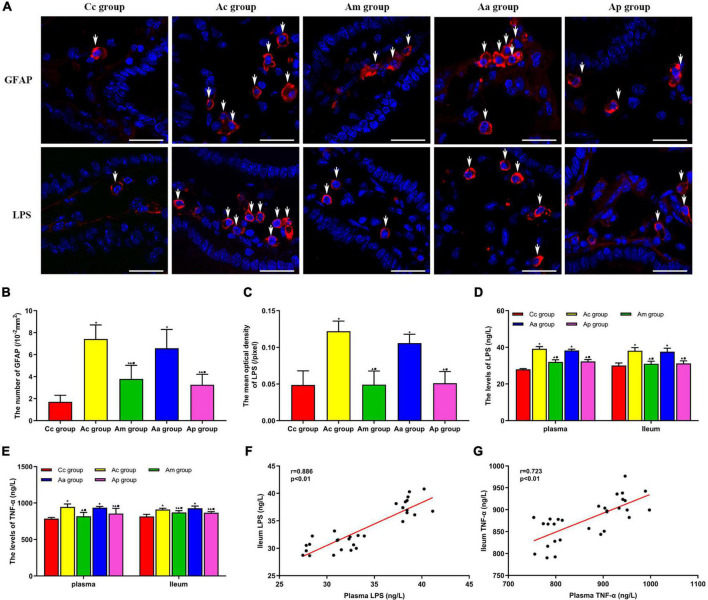
FIGURE 5.
Results of the expression of GFAP, lipopolysaccharide (LPS), and TNF-α in serum and the intestine in each group (n = 6, mean ± SD). (A) Representative images of immunofluorescence (IF) staining of LPS (red) and GFAP (red) in each group, the positively stained cells are shown with white arrows, and scale bar is 25 μm. (B) Comparison between the number of cells expressing GFAP of all groups. (C) Comparison between the mean optical density of LPS of all groups. (D,E) Comparison between the contents of LPS and TNF-α in the serum and intestine of all groups. A one-way analysis of variance (ANOVA), followed by the LSD multiple-range test, was used with exceptions when comparing the number of cells expressing GFAP and the contents of LPS in serum, which were analyzed by the Kruskal–Wallis test. LSD-t and chi-square are presented in Supplementary Tables 5–7. ★P < 0.01 or P < 0.05 compared with the C57BL/6 control (Cc) group. ▲P < 0.01 or P < 0.05 compared with the APP/PS1 control (Ac) group; ■P < 0.01 or P < 0.05 compared with the APP/PS1 antibiotic + manual acupuncture (Aa) group. (F,G) Pearson correlation analysis between LPS and TNF-α in serum and the intestine.

