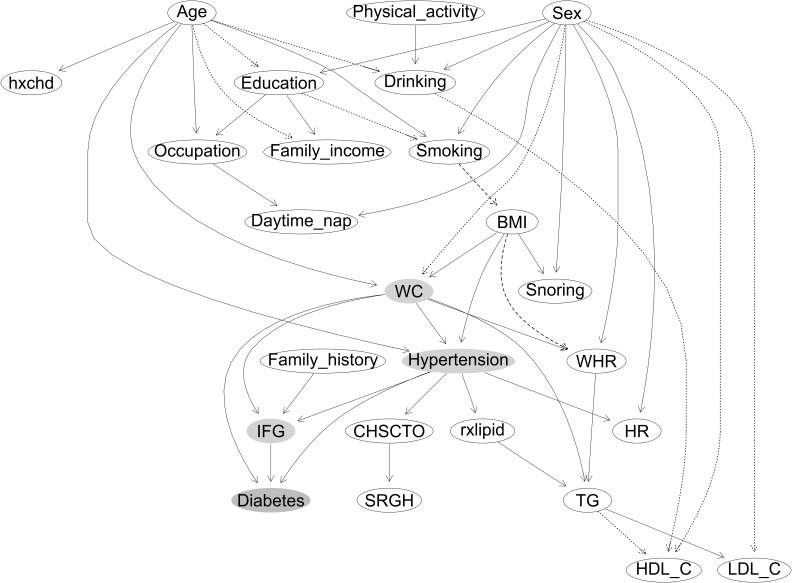
Figure 2.
The constructed Bayesian network model of new-onset diabetes. (1) Labeled ovals represent nodes; arrows (arcs) represent (likely) causal relationships. Node in orange represents the deterministic node, and nodes in blue represent the nodes in the Markov blanket of the deterministic node. Arcs between the nodes with solid lines indicate positive association, and dotted line indicates negative associations. Arcs between the nodes with dashed lines indicate that, compared with the never smokers, former smokers had a higher probability of having greater BMI, whereas current smokers had a lower probability. Compared with those with BMI low than 25 kg/m2, participants with BMI above 25 and less than 30 kg/m2 had a higher probability of having greater WHR, whereas those with BMI above 30 kg/m2 had a lower probability. (2) Variables considered and/or tested were based on previous studies in the literature and data available in the present study, as follows: sex; age; education; occupation; family income; smoking; drinking; physical activity; daytime nap, daytime napping; snoring; CHSCTO, current health status compared with others; SRGN, self-reported general health; hypertension; HR, heat rate; rxlipid, lipid lowering drugs; hxchd, self-reported coronary heart disease; family history, family history of diabetes; BMI, body mass index; WC, waist circumference; WHR, waist-to-hip ratio; TG, triglycerides; HDL-C, high-density lipoprotein-cholesterol; LDL-C, low-density lipoprotein cholesterol; IFG, impaired fasting glucose.

