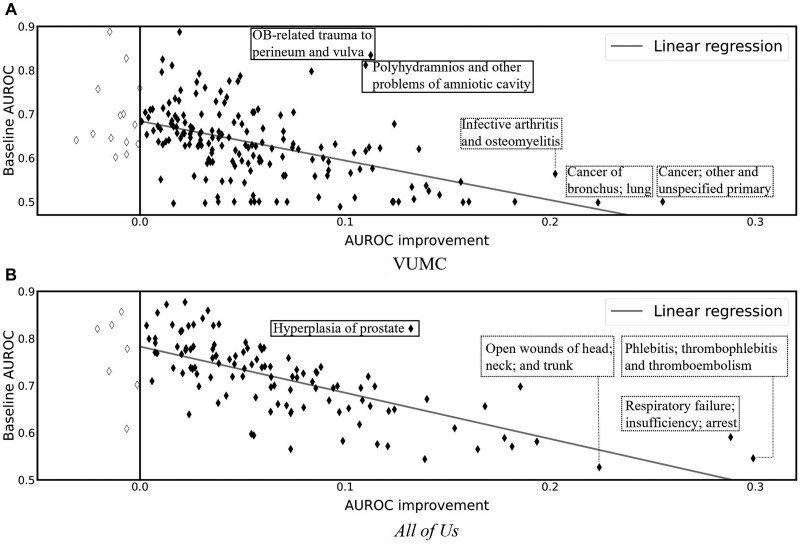
Figure 3.
AUROC improvement achieved through CEF-CL versus AUROC of the baseline with the best performing backbone over the set of CCS codes. Each marker corresponds to a unique task defined by a CCS diagnosis code (the significantly enhanced forecasts with AUROC improvement greater than 0.2 and 0.1 are highlighted with dashed boxes for VUMC and All of Us data, respectively). The gray line is a linear regression line of the observations (VUMC: Slope = −0.90, r2=0.23; All of Us: Slope = −0.98, r2=0.51) as an indication of the correlation between AUROC improvement and the baseline AUROC.

