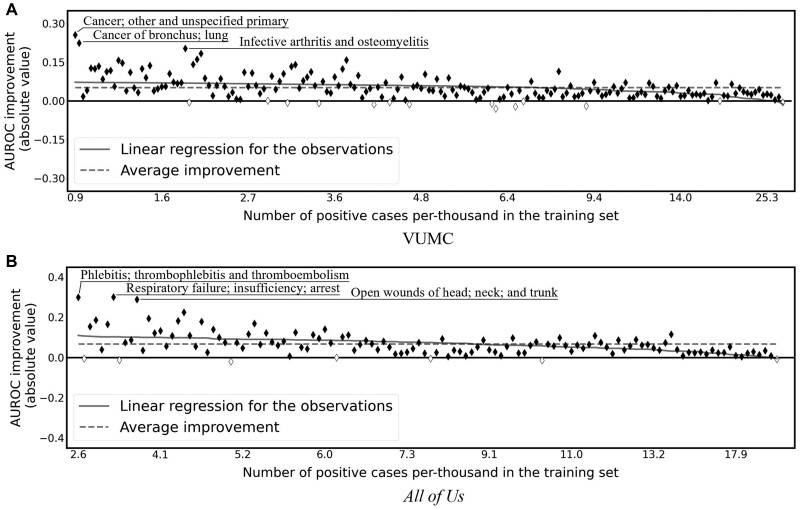
Figure 4.
Absolute AUROC differences in CCS code forecasting tasks with training data under different levels of the number of positive cases. The x-axis corresponds to the number of positive cases per 1000 instances in the training set. Each marker corresponds to a unique task, where solid (hollow) markers indicate positive (negative) improvement. The forecasts with AUROC improvement greater than 0.2 are highlighted with dashed boxes. The solid line is the linear regression line. The dashed horizontal line is a baseline of average improvement of all tasks.

