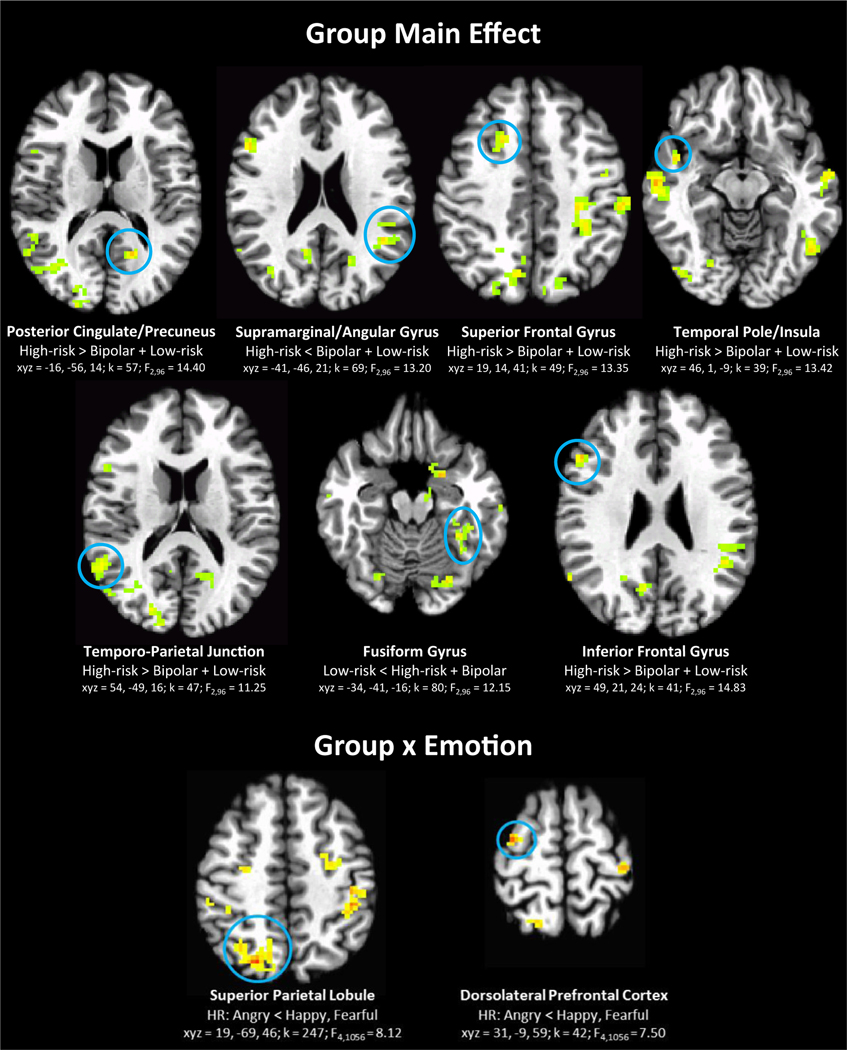
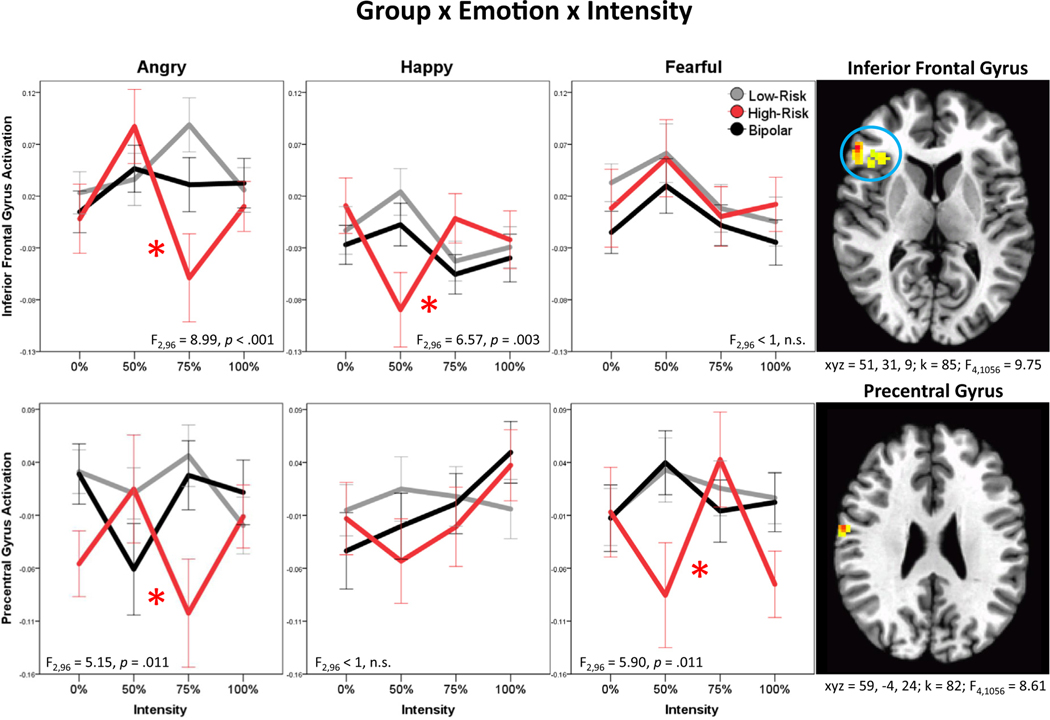
FIGURE 3.
Candidate resilience markers: regions where the high-risk (HR) group shows unique neural alterations, relative to the low-risk (LR) and bipolar disorder (BD) groups across all stimuli (group main effect), dependent on face emotion (group × emotion), and dependent on both face emotion and intensity of emotion (group × emotion × intensity). Note: Intensity modeled cubically in the group × emotion × intensity interaction. F and p values on plots reflect post hoc analyses comparing groups for each emotion separately. All p values reflect false discovery rate (FDR) correction. Asterisks on plots indicate that HR cubic response curve significantly differs from those of LR youth and youth with BD in FDR-corrected post hoc comparisons. See Figure 2 for information on brain images.


