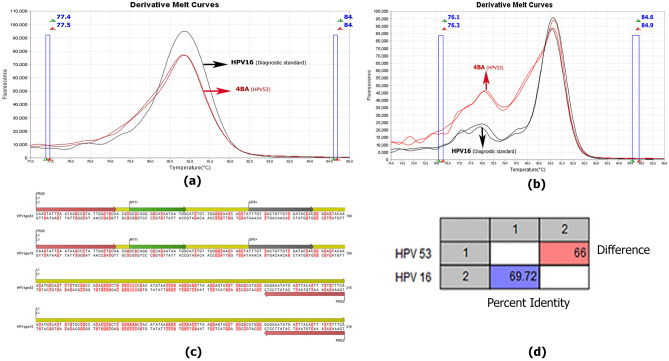
Figure 3.
Derivative melt curve released of approach one, related to HPV 16 as a diagnostic standard and isolate 4BA as microarray-identification HPV 53 (a). Derivative melt curve released of approach two, related to HPV 16 as a diagnostic standard and isolate 4BA as microarray-identification HPV 53 (b). Schematic map of the amplification region of human papillomaviruses 16 and 53 in this study and the location of the primers using CLC workbench 12 software (c). Pairwise comparison of the amplified region in approach one related to HPV 16 (diagnostic standard) and isolate 4BA (HPV 53) using CLC workbench 12 software (d).

